OPEN-SOURCE SCRIPT
Same Day Past Candles
Same-Day Past Candles
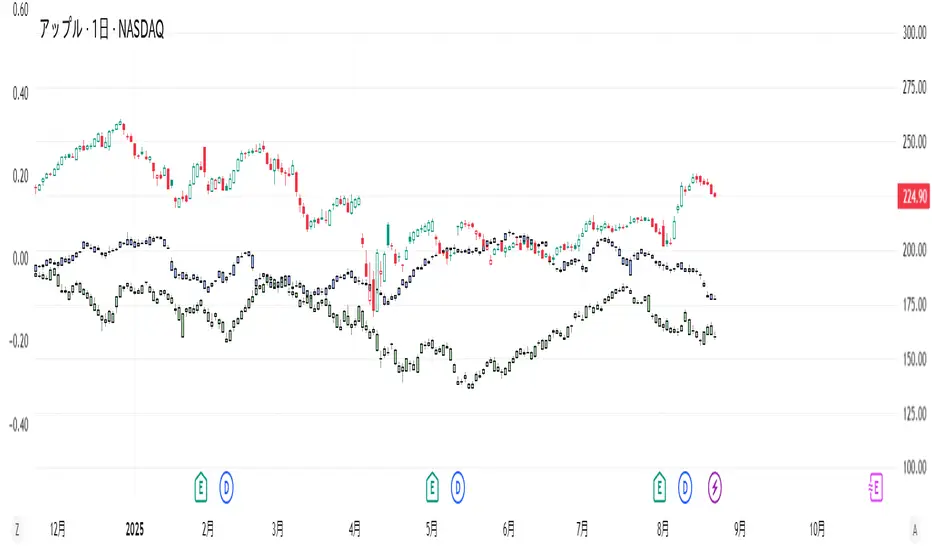
This indicator is a tool that plots the shapes of the candles from the same date one and two years ago directly on the current chart. By visually comparing past price movements, it can help you analyze seasonality and cyclical patterns.

Key Features
Plots Past Candles: Displays candles from the same date one and two years ago on your current chart.
Toggle Visibility: You can individually turn the display of the "1 year ago candle" and "2 years ago candle" on or off in the indicator's settings.
Candle Shape: The open, high, low, and close prices of the past candles are plotted, scaled to the current price range.
How to Use
Add this indicator to a daily chart for best results. The plotted candles are slightly offset upwards so they don't overlap with the current price, making it easier to compare the shape of the past candles with the current chart movement.
Visually checking how specific past price changes are reflected on the same day this year can provide insights for your trading strategy.
[Important Notice]
I do not speak English at all. Please understand that if you send me a message, I may not be able to reply, or my reply may have a different meaning. Thank you for your understanding.
This indicator is a tool that plots the shapes of the candles from the same date one and two years ago directly on the current chart. By visually comparing past price movements, it can help you analyze seasonality and cyclical patterns.
Key Features
Plots Past Candles: Displays candles from the same date one and two years ago on your current chart.
Toggle Visibility: You can individually turn the display of the "1 year ago candle" and "2 years ago candle" on or off in the indicator's settings.
Candle Shape: The open, high, low, and close prices of the past candles are plotted, scaled to the current price range.
How to Use
Add this indicator to a daily chart for best results. The plotted candles are slightly offset upwards so they don't overlap with the current price, making it easier to compare the shape of the past candles with the current chart movement.
Visually checking how specific past price changes are reflected on the same day this year can provide insights for your trading strategy.
[Important Notice]
I do not speak English at all. Please understand that if you send me a message, I may not be able to reply, or my reply may have a different meaning. Thank you for your understanding.
نص برمجي مفتوح المصدر
بروح TradingView الحقيقية، قام مبتكر هذا النص البرمجي بجعله مفتوح المصدر، بحيث يمكن للمتداولين مراجعة وظائفه والتحقق منها. شكرا للمؤلف! بينما يمكنك استخدامه مجانًا، تذكر أن إعادة نشر الكود يخضع لقواعد الموقع الخاصة بنا.
The Leap 1000位以内2回
The Leap Top 1000 Rank (x2), currently Top 1500.
(Mostly luck, though!)
AI Assessment: A Professional Whose Obsession Has Evolved into Instinct
だそーです
The Leap Top 1000 Rank (x2), currently Top 1500.
(Mostly luck, though!)
AI Assessment: A Professional Whose Obsession Has Evolved into Instinct
だそーです
إخلاء المسؤولية
لا يُقصد بالمعلومات والمنشورات أن تكون، أو تشكل، أي نصيحة مالية أو استثمارية أو تجارية أو أنواع أخرى من النصائح أو التوصيات المقدمة أو المعتمدة من TradingView. اقرأ المزيد في شروط الاستخدام.