OPEN-SOURCE SCRIPT
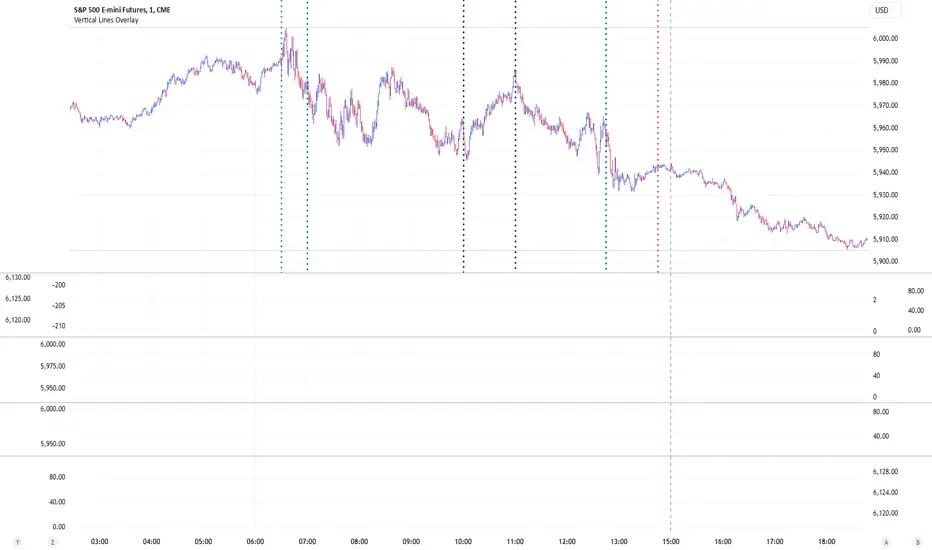
Vertical Lines Overlay

Vertical Lines Overlay with Custom Time Inputs
This script allows users to draw vertical lines on their charts at specific times of the day, providing a customizable tool for marking key events, session changes, or any other time-based analysis.
Features:
Customizable Time Inputs: Set up to 6 distinct times (hours and minutes) to draw vertical lines.
Line Style Options: Choose between solid, dotted, or dashed line styles for each line.
Line Width Control: Adjust the thickness of each line individually.
Color Selection: Assign unique colors to each vertical line for better visibility and organization.
Dynamic Time Offsets: Adjust line positions with predefined time offsets, ensuring compatibility across different trading instruments and time zones.
Automatic Line Drawing: Lines are plotted automatically at the specified times if the conditions are met.
How to Use:
Open the settings panel by clicking the gear icon.
Enable or disable each line by toggling the respective checkboxes.
Set the desired time for each line using the hour and minute inputs.
Customize line styles, widths, and colors for each line.
Optionally, apply a time offset based on your trading instrument or preference.
نص برمجي مفتوح المصدر
بروح TradingView الحقيقية، قام مبتكر هذا النص البرمجي بجعله مفتوح المصدر، بحيث يمكن للمتداولين مراجعة وظائفه والتحقق منها. شكرا للمؤلف! بينما يمكنك استخدامه مجانًا، تذكر أن إعادة نشر الكود يخضع لقواعد الموقع الخاصة بنا.
إخلاء المسؤولية
لا يُقصد بالمعلومات والمنشورات أن تكون، أو تشكل، أي نصيحة مالية أو استثمارية أو تجارية أو أنواع أخرى من النصائح أو التوصيات المقدمة أو المعتمدة من TradingView. اقرأ المزيد في شروط الاستخدام.