PROTECTED SOURCE SCRIPT
Pinks Statistical Support and Resistance

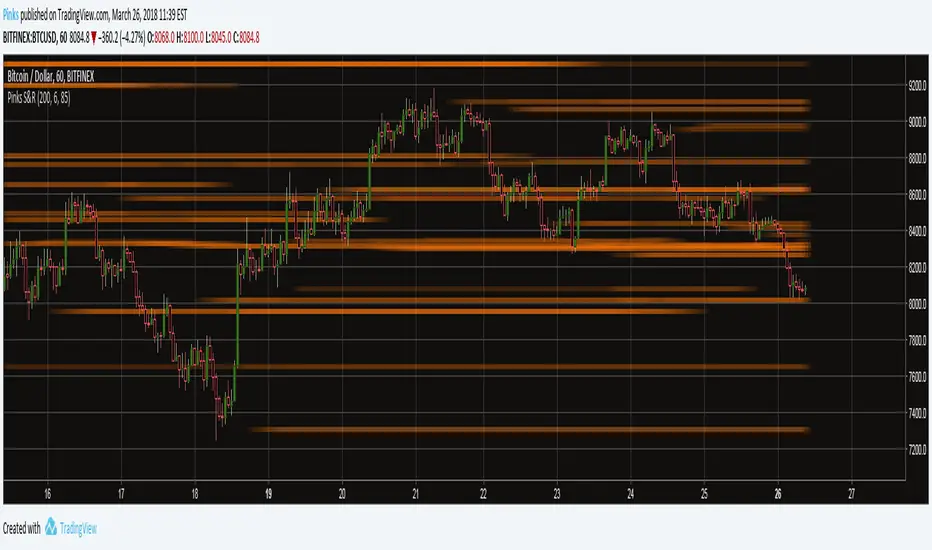
Support and Resistance levels based on statistical methods
This is an autonomous Support and Resistance (S&R) indicator that locates levels where the price of an asset is likely to meet resistance or support. It works on all timeframes, and on any asset. It is more advanced than many other indicators that purport to do the same thing.
How to use Pinks Statistical Support and Resistance
It is recommended to turn off Indicator Values when using this indicator. Do do this, perform the following:
Parameters
Length: How many candles in the past the algorithm will use for calculating S&R levels.
Cleanup parameter: How strongly the algorithm will discard certain datapoints it does not consider important in its calculations.
Acceptance: This parameter sets the limit for what the algorithm considers a S&R level. Lower values will display more (and weaker) levels, higher values will show fewer (and stronger) levels.
This is an autonomous Support and Resistance (S&R) indicator that locates levels where the price of an asset is likely to meet resistance or support. It works on all timeframes, and on any asset. It is more advanced than many other indicators that purport to do the same thing.
How to use Pinks Statistical Support and Resistance
It is recommended to turn off Indicator Values when using this indicator. Do do this, perform the following:
- Right click somewhere on your chart window background
- Click Properties
- Click on the "Background" tab
- Uncheck "Indicator Values*
Parameters
Length: How many candles in the past the algorithm will use for calculating S&R levels.
Cleanup parameter: How strongly the algorithm will discard certain datapoints it does not consider important in its calculations.
Acceptance: This parameter sets the limit for what the algorithm considers a S&R level. Lower values will display more (and weaker) levels, higher values will show fewer (and stronger) levels.
نص برمجي محمي
تم نشر هذا النص البرمجي كمصدر مغلق. ومع ذلك، يمكنك استخدامه بحرية ودون أي قيود - تعرف على المزيد هنا.
إخلاء المسؤولية
لا يُقصد بالمعلومات والمنشورات أن تكون، أو تشكل، أي نصيحة مالية أو استثمارية أو تجارية أو أنواع أخرى من النصائح أو التوصيات المقدمة أو المعتمدة من TradingView. اقرأ المزيد في شروط الاستخدام.