High Volume Key Hidden Level
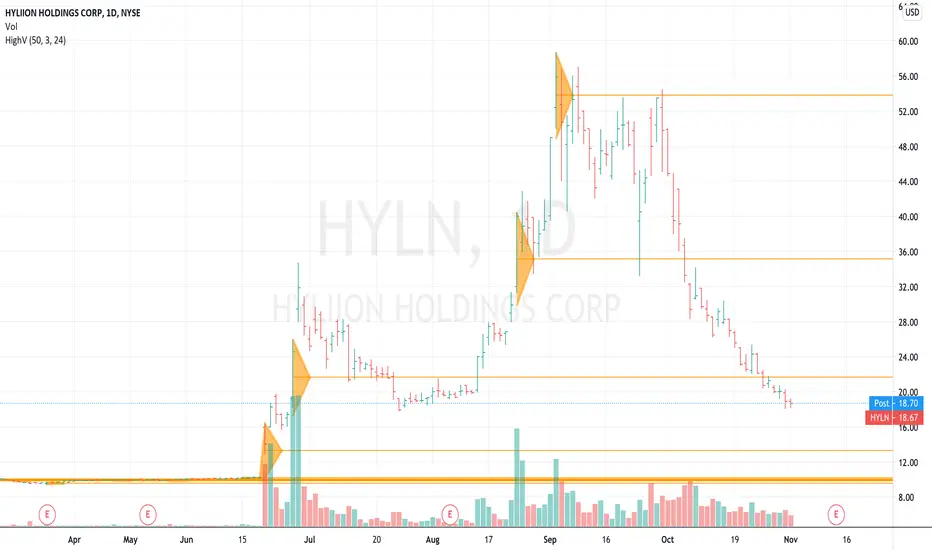
Generally speaking, if the market rallies into a line then look for the market to stall at the line as it is a level of supply. Likewise, if the market falls down to a high volume level, then it would be logical to assume there is support at that level especially on the first and second revisit.
The indicator is adjustable so you can filter out to whatever multiple of any average. Some markets rarely have 3-times volume events, so you may have to adjust for each symbol.
High volume events indicate that news or an event has occured and should mark an important level where traders and investors may be interested in trading at that level again.
I would consider an uptrend to be in tact when the market is above the latest "high volume bar" and in a downtrend when the market is under the latest "high volume bar".
We use green triangles to plot earnings-release dates and blue triangles for dividends, yellow triangles for range expansion moves and black triangles for emotions (good and bad emotions such has fear and excitement).
نص برمجي للمستخدمين المدعوين فقط
يمكن فقط للمستخدمين الذين تمت الموافقة عليهم من قبل المؤلف الوصول إلى هذا البرنامج النصي. ستحتاج إلى طلب الإذن والحصول عليه لاستخدامه. يتم منح هذا عادةً بعد الدفع. لمزيد من التفاصيل، اتبع تعليمات المؤلف أدناه أو اتصل ب timwest مباشرة.
لا توصي TradingView بالدفع مقابل برنامج نصي أو استخدامه إلا إذا كنت تثق تمامًا في مؤلفه وتفهم كيفية عمله. يمكنك أيضًا العثور على بدائل مجانية ومفتوحة المصدر في نصوص مجتمعنا.
تعليمات المؤلف
إخلاء المسؤولية
نص برمجي للمستخدمين المدعوين فقط
يمكن فقط للمستخدمين الذين تمت الموافقة عليهم من قبل المؤلف الوصول إلى هذا البرنامج النصي. ستحتاج إلى طلب الإذن والحصول عليه لاستخدامه. يتم منح هذا عادةً بعد الدفع. لمزيد من التفاصيل، اتبع تعليمات المؤلف أدناه أو اتصل ب timwest مباشرة.
لا توصي TradingView بالدفع مقابل برنامج نصي أو استخدامه إلا إذا كنت تثق تمامًا في مؤلفه وتفهم كيفية عمله. يمكنك أيضًا العثور على بدائل مجانية ومفتوحة المصدر في نصوص مجتمعنا.