OPEN-SOURCE SCRIPT
Weighted Momentum Forecast

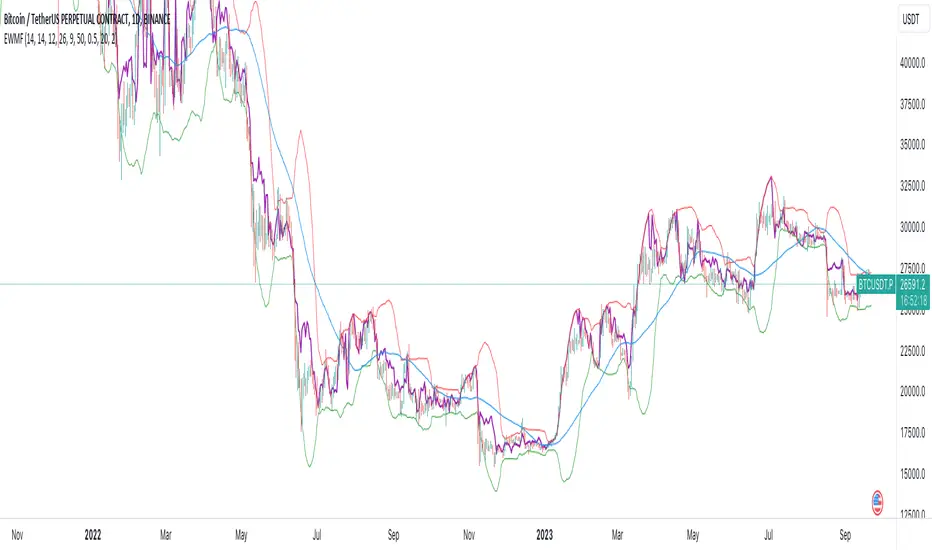
The Weighted Momentum Forecast (EWMF) is a predictive indicator designed to forecast the potential direction and magnitude of the next candle's close. It combines the principles of momentum, trend confirmation, and volatility adjustment to make its predictions.
**Components:**
1. **Rate of Change (ROC)**: Measures the momentum of the market.
2. **Average True Range (ATR)**: Represents the market's recent volatility.
3. **Moving Average Convergence Divergence (MACD)**: Used to confirm the momentum's direction.
4. **Trend Moving Average**: A longer-term moving average to confirm the general trend.
5. **Bollinger Bands**: Adjusts the forecast to account for extreme predictions.
**Logic:**
1. **Momentum Bias**: The crossover and crossunder of the MACD line and its signal line are used to determine the momentum's bias. A crossover indicates a bullish bias, while a crossunder indicates a bearish bias.
2. **Trend Confirmation**: If the current close is above the trend moving average, the indicator has a bullish bias, and vice versa.
3. **Forecast Calculation**: The forecast for the next candle's close is calculated based on the current close, the rate of change, the momentum's bias, and the trend's bias. This value is then adjusted for volatility using the ATR.
4. **Volatility Adjustment**: If the forecasted value is beyond the Bollinger Bands, it's adjusted to be within the bands to account for extreme predictions.
**Usage:**
The EWMF plots a purple line representing the forecasted value of the next candle's close. This forecasted value provides traders with a visual representation of where the price might head in the next period, based on recent momentum, trend, and volatility.
**Note**: This is a heuristic approach and is not guaranteed to be accurate. It's essential to use this indicator in conjunction with other tools, backtest on historical data, and use proper risk management techniques. Always be aware of the inherent risks involved in trading and never risk more than you're willing to lose.
نص برمجي مفتوح المصدر
بروح TradingView الحقيقية، قام مبتكر هذا النص البرمجي بجعله مفتوح المصدر، بحيث يمكن للمتداولين مراجعة وظائفه والتحقق منها. شكرا للمؤلف! بينما يمكنك استخدامه مجانًا، تذكر أن إعادة نشر الكود يخضع لقواعد الموقع الخاصة بنا.
إخلاء المسؤولية
لا يُقصد بالمعلومات والمنشورات أن تكون، أو تشكل، أي نصيحة مالية أو استثمارية أو تجارية أو أنواع أخرى من النصائح أو التوصيات المقدمة أو المعتمدة من TradingView. اقرأ المزيد في شروط الاستخدام.