OPEN-SOURCE SCRIPT
تم تحديثه First 5-Minute Premarket High/Low Break Retest

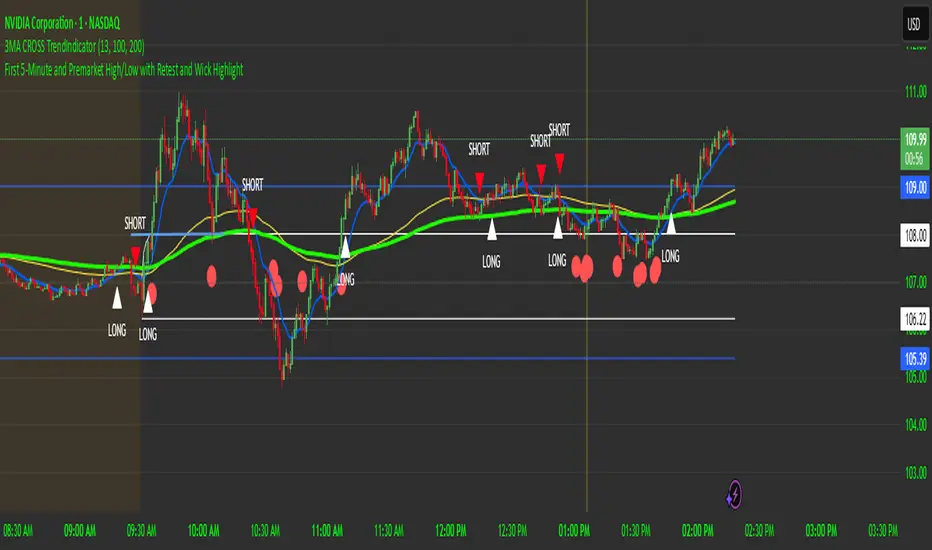
Day trading method that uses the 5 minute candle high and low but trade on the 1 minute chart.
This is a break and retest trading strategy based on the market open 5 minute high and low candle.
Additional levels would be the premarket high and low plotted in blue on the chart. It's not uncommon for the 5 minute to be near the premarket high and low zone.
The break and restest of the 5 minute white lines either to the downside or upside. Once a hammer or long wick candle forms near or touching the retest of the 5 minute line that indicates an entry point.
It's best to have another confirmation for entry such as the 13 and 100 ema cross to confirm good position and risk.
This is a repetable and solid trading strategy. The indicator was created to plot on the 1 and 5 minute charts.
ملاحظات الأخبار
Key changes made:Replaced all "GMT-5" references with "America/New_York" in the timestamp() calls
Maintained all original market hours (4:00 AM for premarket, 9:30 AM open, and 4:00 PM close)
The timezone specification will now automatically adjust between EST (UTC-5) and EDT (UTC-4) based on daylight savings time
This ensures the script correctly aligns with New York market hours year-round, accounting for both standard time and daylight savings time transitions.
نص برمجي مفتوح المصدر
بروح TradingView الحقيقية، قام مبتكر هذا النص البرمجي بجعله مفتوح المصدر، بحيث يمكن للمتداولين مراجعة وظائفه والتحقق منها. شكرا للمؤلف! بينما يمكنك استخدامه مجانًا، تذكر أن إعادة نشر الكود يخضع لقواعد الموقع الخاصة بنا.
إخلاء المسؤولية
لا يُقصد بالمعلومات والمنشورات أن تكون، أو تشكل، أي نصيحة مالية أو استثمارية أو تجارية أو أنواع أخرى من النصائح أو التوصيات المقدمة أو المعتمدة من TradingView. اقرأ المزيد في شروط الاستخدام.