PROTECTED SOURCE SCRIPT
Candle Range Theory - Higher-Timeframe Scanner
The CRT Range Scanner is a sophisticated trading tool that identifies potential Candle Range Theory (CRT) completions across multiple timeframes. Based on the Inner Circle Trader methodology, this indicator helps traders spot key market structure breaks and range expansions.
Key Features:
🔍 Higher-Timeframe Analysis: Automatically detects CRT patterns on higher timeframes while you trade on lower timeframes
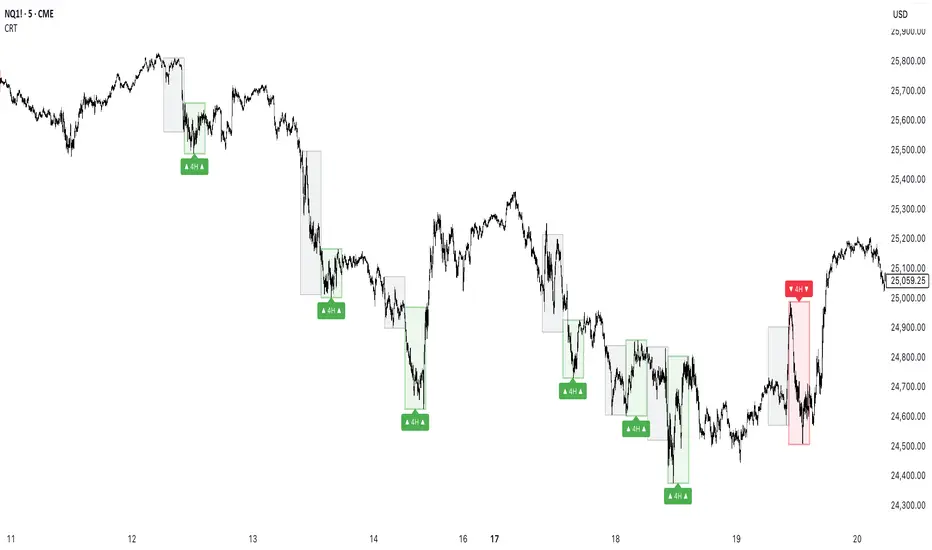
🎯 Bullish & Bearish CRT Signals: Identifies both bullish (range expansion to downside) and bearish (range expansion to upside) completions
⏰ Kill Zone Filtering: Customizable trading sessions to focus only on high-probability market hours
📊 Visual Range Boxes: Clear visual representation of current and previous higher timeframe ranges
🏷️ Smart Labeling: Timeframe-specific labels for easy pattern recognition
How It Works:
Bullish CRT: Occurs when price breaks below previous low during specific session times, indicating potential bullish reversal
Bearish CRT: Occurs when price breaks above previous high during specific session times, indicating potential bearish reversal
The indicator draws colored boxes around the relevant price ranges and provides clear visual cues for pattern recognition
Key Features:
🔍 Higher-Timeframe Analysis: Automatically detects CRT patterns on higher timeframes while you trade on lower timeframes
🎯 Bullish & Bearish CRT Signals: Identifies both bullish (range expansion to downside) and bearish (range expansion to upside) completions
⏰ Kill Zone Filtering: Customizable trading sessions to focus only on high-probability market hours
📊 Visual Range Boxes: Clear visual representation of current and previous higher timeframe ranges
🏷️ Smart Labeling: Timeframe-specific labels for easy pattern recognition
How It Works:
Bullish CRT: Occurs when price breaks below previous low during specific session times, indicating potential bullish reversal
Bearish CRT: Occurs when price breaks above previous high during specific session times, indicating potential bearish reversal
The indicator draws colored boxes around the relevant price ranges and provides clear visual cues for pattern recognition
نص برمجي محمي
تم نشر هذا النص البرمجي كمصدر مغلق. ومع ذلك، يمكنك استخدامه بحرية ودون أي قيود - تعرف على المزيد هنا.
Luck Is What Happens When Preparation Meets Opportunity
إخلاء المسؤولية
لا يُقصد بالمعلومات والمنشورات أن تكون، أو تشكل، أي نصيحة مالية أو استثمارية أو تجارية أو أنواع أخرى من النصائح أو التوصيات المقدمة أو المعتمدة من TradingView. اقرأ المزيد في شروط الاستخدام.