OPEN-SOURCE SCRIPT
تم تحديثه Seasonality: Month Highlight
Many Assets, especially Commodities , have patterns of seasonality: Periods in the year when they have shown a greater tendency to rise or a greater tendency to fall.
The Seasonality of an asset is based on historical data (20yrs+): Specific asset seasonality charts can be found via an online search.
This is a simple tool that allows users to highlight and color code each of the 12 months of the year; depending on the seasonality of the specific asset.
The above chart shows Sugar Futures ; which are a seasonal 'sell' in February , and a seasonal 'buy' in May and August.
Seasonality should only be used to compliment a trading setup, NOT as a single reason in itself to buy or sell. Simply put: if you find a good setup, AND you have seasonality on your side; your odds of success are increased.
ملاحظات الأخبار
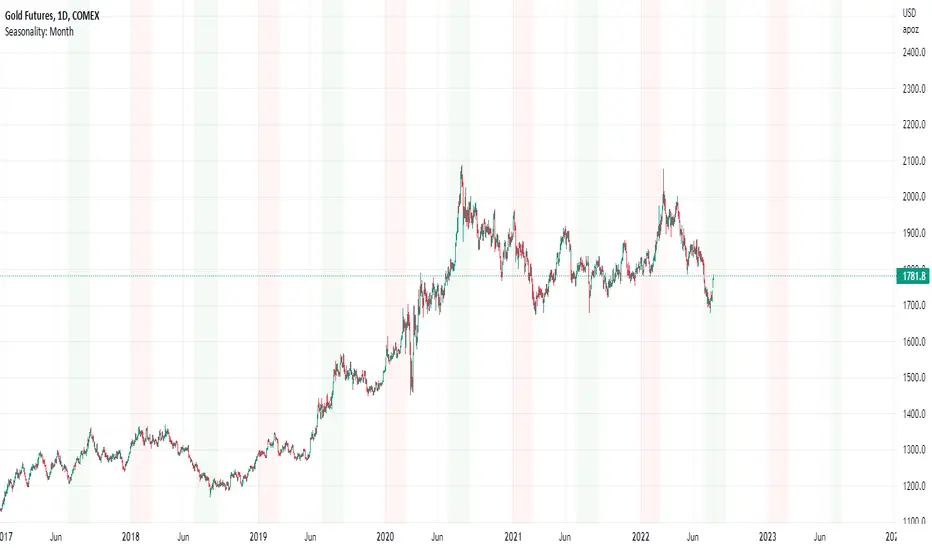
~Now plots future & past background month highlights (future highlight only on Daily timeframe)~More formatting options; choose each month and choose its respective background color
~Shown above with Gold seasonal tendency bullish/bearish months
ملاحظات الأخبار
Correction: Rather than saying "Gold seasonal tendency bullish/bearish months";
More properly I should say, months where one might look for a seasonally supported 'Buy' or a seasonally supported 'Sell' in Gold
نص برمجي مفتوح المصدر
بروح TradingView الحقيقية، قام مبتكر هذا النص البرمجي بجعله مفتوح المصدر، بحيث يمكن للمتداولين مراجعة وظائفه والتحقق منها. شكرا للمؤلف! بينما يمكنك استخدامه مجانًا، تذكر أن إعادة نشر الكود يخضع لقواعد الموقع الخاصة بنا.
You can buy me a coffee here...
PayPal.Me/twingall
BTC: 3JrhUwNRnKyqhaa1n1AXKeAubNeEFoch6S
ETH erc20: 0x4b0400B1c18503529ab69611e82a934DDe4Ab038
ETH bep20: 0x1F0f03F184079bb1085F8C9dF3a8191C9f5869B3
PayPal.Me/twingall
BTC: 3JrhUwNRnKyqhaa1n1AXKeAubNeEFoch6S
ETH erc20: 0x4b0400B1c18503529ab69611e82a934DDe4Ab038
ETH bep20: 0x1F0f03F184079bb1085F8C9dF3a8191C9f5869B3
إخلاء المسؤولية
لا يُقصد بالمعلومات والمنشورات أن تكون، أو تشكل، أي نصيحة مالية أو استثمارية أو تجارية أو أنواع أخرى من النصائح أو التوصيات المقدمة أو المعتمدة من TradingView. اقرأ المزيد في شروط الاستخدام.