INVITE-ONLY SCRIPT
RSI_CMO_Scanner

Have you ever wanted to scan across many tickers and monitor an indicator across time for these selected tickers?
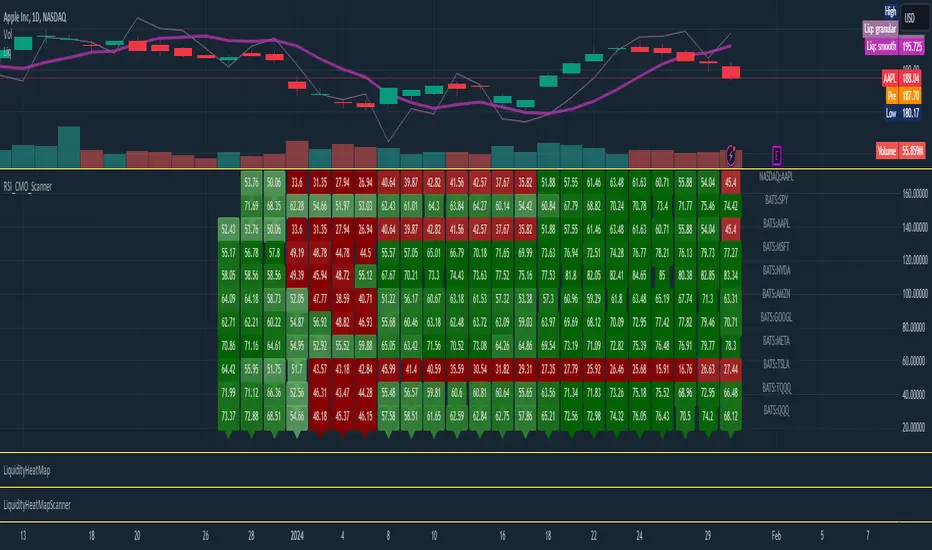
Have you ever wanted to monitor the Mag7 and SPY simultaneously and watch a divergence take place real time across all selected tickers?
With this indicator, you can now view 100 tickers (in batches of 10) for either Stocks, Crypto or Forex, with a HeatMap visualisation for the selected timeframe.
This particular indicator utilises the RSI or the CMO to provide this view, where colors change from deep red (low values) to dark green (high values) and provide the HeatMap sense of how this metric changes across time.
The values within the labels can be switched on and off from the Settings, depending on the user's preference.
Additionally, the tickers can be selected through the Settings from the Stocks, Crypto or Forex groups
The originality and usefulness of this indicator is that it provides a simultaneous view across batches of 10 tickers for a lookback of values in the given timeframe. Also, the view is served as a heatmap, for a visual understanding of the fluctuation over time.
The same logic can be applied to a variety of indicators, besides the RSI and the CMO.
نص برمجي للمستخدمين المدعوين فقط
الوصول إلى هذا النص مقيد للمستخدمين المصرح لهم من قبل المؤلف وعادة ما يكون الدفع مطلوباً. يمكنك إضافته إلى مفضلاتك، لكن لن تتمكن من استخدامه إلا بعد طلب الإذن والحصول عليه من مؤلفه. تواصل مع iKiok للحصول على مزيد من المعلومات، أو اتبع إرشادات المؤلف أدناه.
لا تقترح TradingView الدفع مقابل النصوص البرمجية واستخدامها حتى تثق بنسبة 100٪ في مؤلفها وتفهم كيفية عملها. في كثير من الحالات، يمكنك العثور على بديل جيد مفتوح المصدر مجانًا في نصوص مجتمع الخاصة بنا .
تعليمات المؤلف
″please contact ivol.analysis@gmail.com for access to this script
هل تريد استخدام هذا النص البرمجي على الرسم البياني؟
تحذير: يرجى القراءة قبل طلب الوصول.
إخلاء المسؤولية
لا يُقصد بالمعلومات والمنشورات أن تكون، أو تشكل، أي نصيحة مالية أو استثمارية أو تجارية أو أنواع أخرى من النصائح أو التوصيات المقدمة أو المعتمدة من TradingView. اقرأ المزيد في شروط الاستخدام.