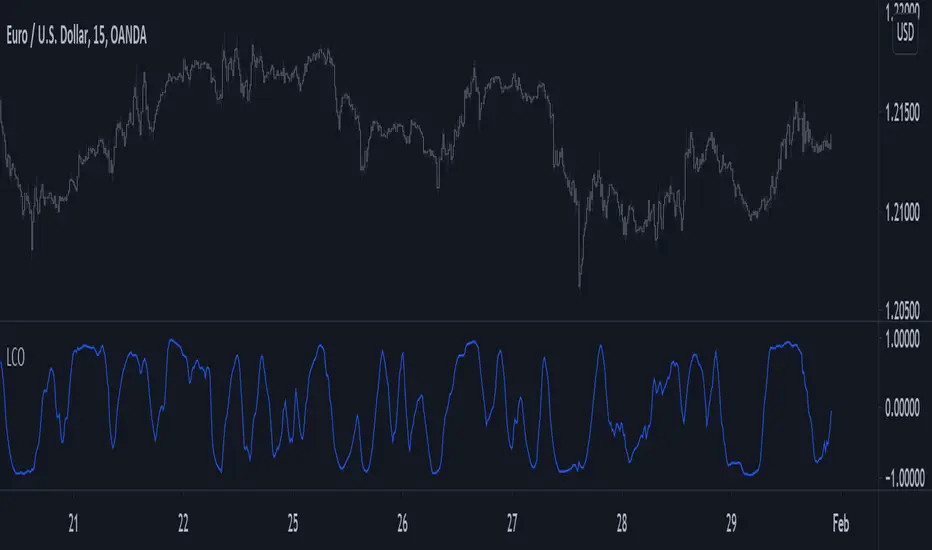
You don't need loops to get the rolling correlation between an input series and a linear sequence of values, this can be obtained from the normalized difference between a WMA and an SMA of the input series.
The closed-form solutions for the moving average and standard deviation of a linear sequence can be easily calculated, while the same rolling statistics for the input series can be computed using cumulative sums. All these concepts were introduced in previous indicators posts long ago.
This approach can allow to efficiently compute the rolling R-Squared of a linear regression, as well as its SSE.
Using the rolling correlation as a trend indicator is often attributed to John Ehlers with the correlation trend indicator (Correlation As A Trend Indicator), but the applications of this precise method can be traced back quite a while ago by a wide variety of users, in fact, the LSMA can be computed using this precise indicator. You can see an example where the correlation oscillator appears below:

نص برمجي مفتوح المصدر
بروح TradingView الحقيقية، قام مبتكر هذا النص البرمجي بجعله مفتوح المصدر، بحيث يمكن للمتداولين مراجعة وظائفه والتحقق منها. شكرا للمؤلف! بينما يمكنك استخدامه مجانًا، تذكر أن إعادة نشر الكود يخضع لقواعد الموقع الخاصة بنا.
Check out the indicators we are making at luxalgo: tradingview.com/u/LuxAlgo/
"My heart is so loud that I can't hear the fireworks"
"My heart is so loud that I can't hear the fireworks"
إخلاء المسؤولية
لا يُقصد بالمعلومات والمنشورات أن تكون، أو تشكل، أي نصيحة مالية أو استثمارية أو تجارية أو أنواع أخرى من النصائح أو التوصيات المقدمة أو المعتمدة من TradingView. اقرأ المزيد في شروط الاستخدام.
