INVITE-ONLY SCRIPT
Thunderbird PoC
What kind of traders/investors are we?
We are trend followers. Our scripts are designed to be used on the higher timeframes (daily/weekly/monthly) to catch significant moves/trends in the market. While many are aware of the power of trend following, not all have the tools to execute it effectively. Our scripts are tailored to pinpoint and capitalise on long-term market trends.
What does this script do?
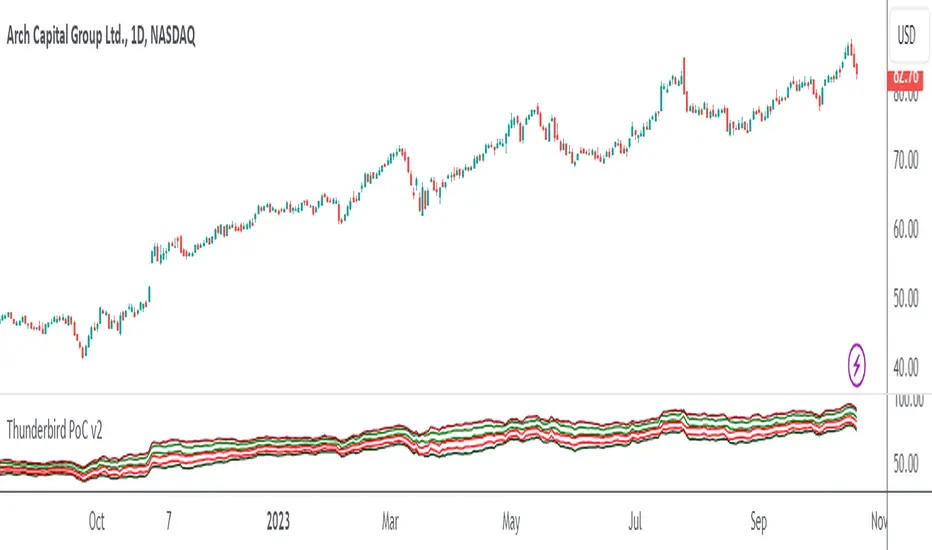
The Thunderbird PoC is a tool for investors looking to capitalise on breakout opportunities. When a breakout of the Donchian occurs, the script produces a signal. This signal is then used to display the entry, stop, and compound levels in the data window. One of its standout features is its ability to show levels for the bar where the mouse is hovering. This allows investors to analyse entry levels from past signals retrospectively. All this information is also conveniently displayed in the data window.
How is the PoC produced?
The PoC is meticulously calculated using a formula the encapsulates ATR. Upon a breakout signal, an entry-level is determined. For a bullish breakout, the entry is set a fixed % leve above the high, and for a bearish breakout, at a fixed % level below. The stop loss level is then calculated by using the ATR formula below the entry for long positions and above for short positions. The compound level is also set using an ATR formula above the entry for long positions and below for short ones.
What is the best timeframe to use the script?
The Thunderbird PoC is optimised for the daily timeframe. This is where the breakout signals are most effective and reliable. By focusing on the daily timeframe, investors can capture significant market movements and avoid the noise of shorter timeframes.
What makes this script unique?
The Thunderbird PoC stands out in its ability to provide investors with a retrospective view of the market. By allowing users to see the levels for the bar where the mouse is, it offers a unique perspective on past signals, enabling investors to learn and adapt from historical data. This feature, combined with its detailed display in the data window, makes it an invaluable tool for those looking to use trend-following techniques.
This tool removes the need of manually having to calculate the entry, stop loss, compound and risk-free levels yourself.
This script has been coded specifically for the daily timeframe to:
This entry signal script helps investors focus on the quality of a potential position when investing in long-term market trends.
We are trend followers. Our scripts are designed to be used on the higher timeframes (daily/weekly/monthly) to catch significant moves/trends in the market. While many are aware of the power of trend following, not all have the tools to execute it effectively. Our scripts are tailored to pinpoint and capitalise on long-term market trends.
What does this script do?
The Thunderbird PoC is a tool for investors looking to capitalise on breakout opportunities. When a breakout of the Donchian occurs, the script produces a signal. This signal is then used to display the entry, stop, and compound levels in the data window. One of its standout features is its ability to show levels for the bar where the mouse is hovering. This allows investors to analyse entry levels from past signals retrospectively. All this information is also conveniently displayed in the data window.
How is the PoC produced?
The PoC is meticulously calculated using a formula the encapsulates ATR. Upon a breakout signal, an entry-level is determined. For a bullish breakout, the entry is set a fixed % leve above the high, and for a bearish breakout, at a fixed % level below. The stop loss level is then calculated by using the ATR formula below the entry for long positions and above for short positions. The compound level is also set using an ATR formula above the entry for long positions and below for short ones.
What is the best timeframe to use the script?
The Thunderbird PoC is optimised for the daily timeframe. This is where the breakout signals are most effective and reliable. By focusing on the daily timeframe, investors can capture significant market movements and avoid the noise of shorter timeframes.
What makes this script unique?
The Thunderbird PoC stands out in its ability to provide investors with a retrospective view of the market. By allowing users to see the levels for the bar where the mouse is, it offers a unique perspective on past signals, enabling investors to learn and adapt from historical data. This feature, combined with its detailed display in the data window, makes it an invaluable tool for those looking to use trend-following techniques.
This tool removes the need of manually having to calculate the entry, stop loss, compound and risk-free levels yourself.
This script has been coded specifically for the daily timeframe to:
- Highlight the start of potential long-term trends.
- Confirm entry points at the end of the trading day, absorbing intraday noise.
- Reduce fake breakouts in a trend.
- Continue to create entry points as the trend develops to allow for compounding.
- Filter out breakouts in a sideways market.
This entry signal script helps investors focus on the quality of a potential position when investing in long-term market trends.
نص برمجي للمستخدمين المدعوين فقط
الوصول إلى هذا النص مقيد للمستخدمين المصرح لهم من قبل المؤلف وعادة ما يكون الدفع مطلوباً. يمكنك إضافته إلى مفضلاتك، لكن لن تتمكن من استخدامه إلا بعد طلب الإذن والحصول عليه من مؤلفه. تواصل مع Sublime_Trading للحصول على مزيد من المعلومات، أو اتبع إرشادات المؤلف أدناه.
لا تقترح TradingView الدفع مقابل النصوص البرمجية واستخدامها حتى تثق بنسبة 100٪ في مؤلفها وتفهم كيفية عملها. في كثير من الحالات، يمكنك العثور على بديل جيد مفتوح المصدر مجانًا في نصوص مجتمع الخاصة بنا .
تعليمات المؤلف
″This is a tool for Sublime Trading community members only. If you DM us your email, we will send you details on joining the community.
هل تريد استخدام هذا النص البرمجي على الرسم البياني؟
تحذير: يرجى القراءة قبل طلب الوصول.
Join Our Private Community
bit.ly/join-ST-community
Plus Get Our Ultimate Stock Market Blueprint.
bit.ly/join-ST-community
Plus Get Our Ultimate Stock Market Blueprint.
إخلاء المسؤولية
لا يُقصد بالمعلومات والمنشورات أن تكون، أو تشكل، أي نصيحة مالية أو استثمارية أو تجارية أو أنواع أخرى من النصائح أو التوصيات المقدمة أو المعتمدة من TradingView. اقرأ المزيد في شروط الاستخدام.