OPEN-SOURCE SCRIPT
Yearly Open Levels
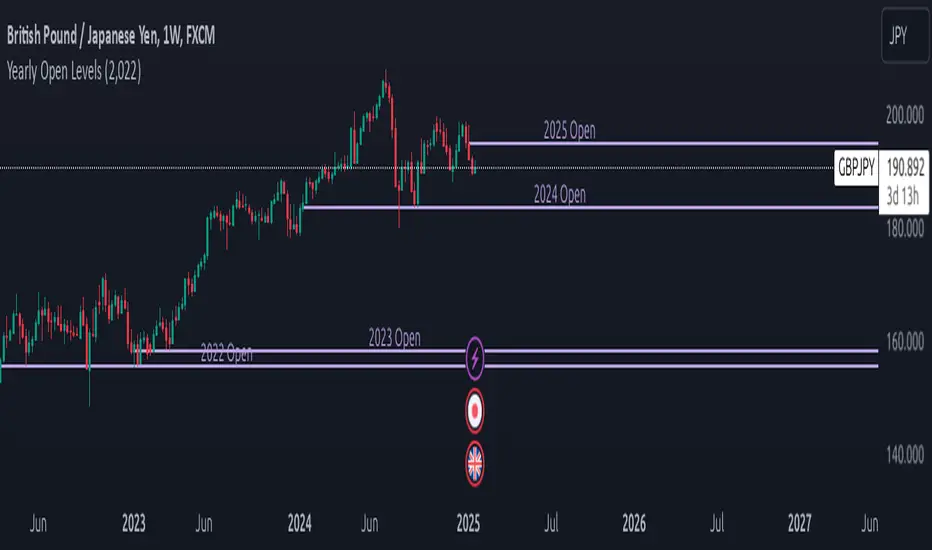
The Yearly Open Levels indicator is designed to help traders visualize the opening price of each year on a price chart.
Key Features:
Yearly Open Display: Automatically calculates and displays the opening price for each year starting from a user-defined starting year. This helps traders quickly spot where the price opens each year.
Customizable Start Year: Users can set a specific year to begin displaying opening levels. The default starting year is 2022, but this can be adjusted based on individual trader needs.
Visual Lines and Labels: Each yearly open is represented by a horizontal line that extends to the right of the chart, making it easy to see the level throughout the year.
A label is placed next to the line, indicating the year and the opening price, enhancing clarity and reference while analyzing price movements.
Color Customization: Traders can choose the color of the lines and labels to fit their charting style or preferences, enhancing the visual representation on different market charts.
نص برمجي مفتوح المصدر
بروح TradingView الحقيقية، قام مبتكر هذا النص البرمجي بجعله مفتوح المصدر، بحيث يمكن للمتداولين مراجعة وظائفه والتحقق منها. شكرا للمؤلف! بينما يمكنك استخدامه مجانًا، تذكر أن إعادة نشر الكود يخضع لقواعد الموقع الخاصة بنا.
إخلاء المسؤولية
لا يُقصد بالمعلومات والمنشورات أن تكون، أو تشكل، أي نصيحة مالية أو استثمارية أو تجارية أو أنواع أخرى من النصائح أو التوصيات المقدمة أو المعتمدة من TradingView. اقرأ المزيد في شروط الاستخدام.