PROTECTED SOURCE SCRIPT
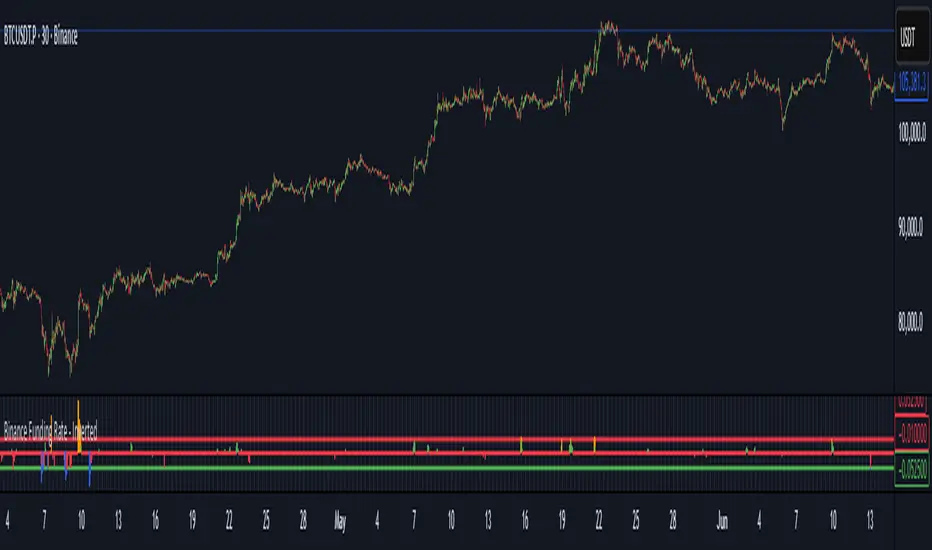
تم تحديثه Binance Funding Rate - Inverted
The Funding Rate Formula
-Binance uses this formula every 8 hours:
-Funding Rate = Premium Index + clamp(Interest Rate - Premium Index, -0.05%, +0.05%)
-Breaking this down:
Premium Index:
-Measures the difference between futures price and spot price
-Interest Rate: Fixed at 0.01% per 8 hours (0.03% daily)
-Clamp Function: Limits the adjustment to ±0.05%, preventing extreme swings
When futures trade above spot (bullish sentiment), the funding rate becomes positive and longs pay shorts. When futures trade below spot (bearish sentiment), it becomes negative and shorts pay longs. This mechanism keeps perpetual futures prices aligned with spot prices.
How to Read This Indicator
The Inverted Display:
-This indicator flips the traditional display to make it more intuitive:
-Green bars pointing up = Negative funding (shorts paying) = Bullish pressure
-Red bars pointing down = Positive funding (longs paying) = Bearish pressure
The Clamp Lines:
-Green line at bottom: Maximum positive funding (-0.06% inverted)
-Red line at top: Maximum negative funding (+0.04% inverted)
-When bars hit these lines and turn blue/orange, it signals extreme market positioning
Practical Trading Applications
1. Identifying Market Extremes
-Small bars (near zero): Balanced market
-Growing bars: Building directional bias
-Bars at clamp lines: Maximum pain for one side, potential reversal
2. Timing Entries/Exits
-Blue bars at bottom: Longs are capitulating, consider buying
-Orange bars at top: Shorts are capitulating, consider selling
-But remember: extremes can persist longer than expected
3. Managing Costs
Check the Data Window (hover over chart) for:
-Actual Funding %: What you'll pay/receive
-Cumulative Fund %: Total impact over your selected period
-If holding positions against the funding direction, you're paying fees 3 times daily
Optimal Usage
-Timeframe: Use 30-minute to 8-hour charts only
-30m: Most responsive to changes
-4h: Cleaner trends
-8h: Aligns with funding periods
Auto-Clamp Setting: Keep enabled - it automatically adjusts the clamp ranges for different timeframes
Risk Considerations
-Funding ≠ Price Direction: High funding doesn't guarantee immediate reversal
-Costs Accumulate: 0.01% three times daily = 10.95% annually
-Whipsaw Risk: Funding can reverse quickly during volatile periods
-Not Standalone: Always confirm with price action and volume
Simple Decision Framework
-Persistent red bars + holding longs = You're bleeding fees
-Persistent green bars + holding shorts = You're bleeding fees
-Bars hitting clamps = Extreme positioning, watch for reversal
-Bars crossing zero = Sentiment shifting
Data Window Values
To see detailed metrics:
-Move cursor over any candle
-Or press Alt+D (Windows) / Option+D (Mac) to open Data Window panel
Key values to monitor:
-Actual Funding %: Real rate (not inverted)
-Cumulative Fund %: Your P&L impact from funding
-Momentum: Rate of change in funding
Remember: This indicator shows market positioning extremes, not guaranteed reversal points. Extreme funding can persist during strong trends. Use it as one input among several for decision-making, not as a sole trading signal.
ملاحظات الأخبار
-Fixed alert messaging to align with inverted scaleنص برمجي محمي
تم نشر هذا النص البرمجي كمصدر مغلق. ومع ذلك، يمكنك استخدامه بحرية ودون أي قيود - تعرف على المزيد هنا.
إخلاء المسؤولية
لا يُقصد بالمعلومات والمنشورات أن تكون، أو تشكل، أي نصيحة مالية أو استثمارية أو تجارية أو أنواع أخرى من النصائح أو التوصيات المقدمة أو المعتمدة من TradingView. اقرأ المزيد في شروط الاستخدام.
نص برمجي محمي
تم نشر هذا النص البرمجي كمصدر مغلق. ومع ذلك، يمكنك استخدامه بحرية ودون أي قيود - تعرف على المزيد هنا.
إخلاء المسؤولية
لا يُقصد بالمعلومات والمنشورات أن تكون، أو تشكل، أي نصيحة مالية أو استثمارية أو تجارية أو أنواع أخرى من النصائح أو التوصيات المقدمة أو المعتمدة من TradingView. اقرأ المزيد في شروط الاستخدام.