OPEN-SOURCE SCRIPT
ECVD by bigmm
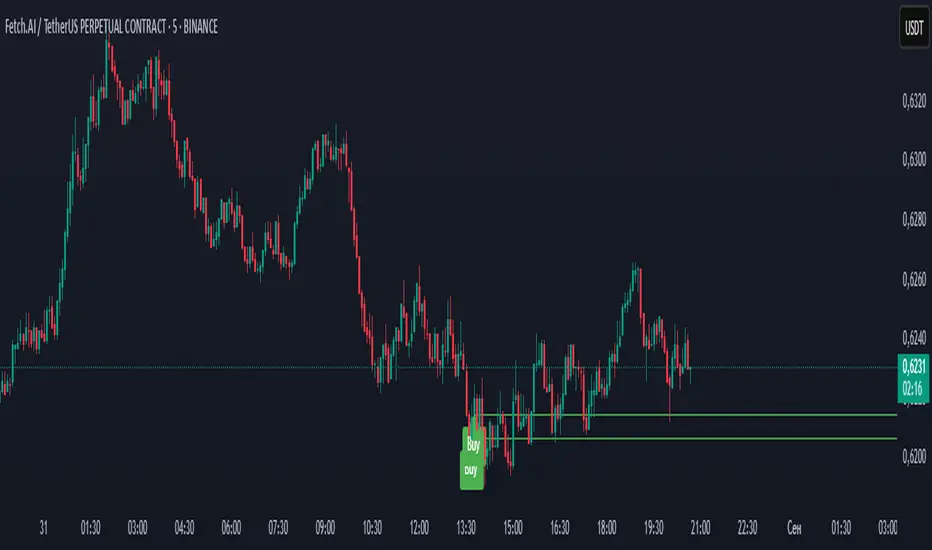
This indicator is designed for scalping and short-term trading, ideally used on 1-5 minute timeframes. It helps identify significant momentum shifts by tracking extreme volume imbalances between buying and selling pressure.
How It Works:
Trading Application:
Best Used For:
This tool works particularly well in combination with price action analysis and other momentum indicators for comprehensive trading decisions.
How It Works:
- The indicator calculates cumulative volume delta (the difference between buying and selling volumes) on a 1-hour timeframe
- It identifies the maximum and minimum delta values over the last 499 bars
- When the current delta reaches or exceeds these extreme values (100% of the recent extremes), it draws horizontal lines on the chart
- Red "Sell" lines appear when buying pressure reaches extreme levels
- Green "Buy" lines appear when selling pressure reaches extreme levels
Trading Application:
- On lower timeframes (1-5 min), these extreme readings often signal potential reversal points
- The lines act as dynamic support/resistance levels where price may react
- The indicator keeps only the 4 most recent lines (2 of each type) to avoid clutter
- Traders can use these signals to anticipate short-term price movements and manage risk
Best Used For:
- Scalping strategies on very short timeframes
- Identifying potential reversal points after strong momentum moves
- Confirming entry and exit points in conjunction with other indicators
- Understanding when volume extremes might be exhausted
This tool works particularly well in combination with price action analysis and other momentum indicators for comprehensive trading decisions.
نص برمجي مفتوح المصدر
بروح TradingView الحقيقية، قام مبتكر هذا النص البرمجي بجعله مفتوح المصدر، بحيث يمكن للمتداولين مراجعة وظائفه والتحقق منها. شكرا للمؤلف! بينما يمكنك استخدامه مجانًا، تذكر أن إعادة نشر الكود يخضع لقواعد الموقع الخاصة بنا.
✅ В ТГ больше идей с указанием точек входа, стоп лосс, тейк профит.
📈 Подробная аналитика и логика входа.
💰Будем зарабатывать вместе с ММ.
t.me/bigmm_channel
📈 Подробная аналитика и логика входа.
💰Будем зарабатывать вместе с ММ.
t.me/bigmm_channel
إخلاء المسؤولية
لا يُقصد بالمعلومات والمنشورات أن تكون، أو تشكل، أي نصيحة مالية أو استثمارية أو تجارية أو أنواع أخرى من النصائح أو التوصيات المقدمة أو المعتمدة من TradingView. اقرأ المزيد في شروط الاستخدام.