OPEN-SOURCE SCRIPT
تم تحديثه Mayer Multiple
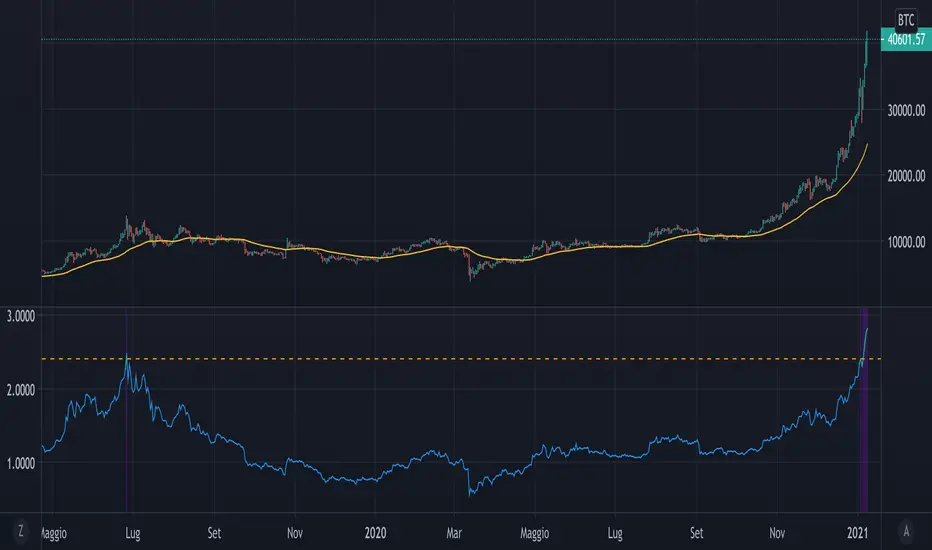
The script implements a custom version of the Mayer multiple and it may be useful for analyzing the price of Bitcoin in a historical context.
Note n.1: Mayer multiple does not tell whether to buy, sell or hold, but highlights the best long-term area when the bitcoin price is below a threshold value (2.4).
Note n.2: the threshold value (2.4) has been determined in the past by simulations performed.
The script user may decide whether to use the shown graph or another graph for the calculation of the Mayer multiple.
The script is very easy to use and it is possible to change the following parameters:
- the period of SMA (default value is 200)
- the threshold (default value 2.4)
- Show or not the sell area
- Use or not the shown graph to calculate the Mayer multiple (default value is true)
- name of exchange to use for calculation of the Mayer multiple (default value is BNC)
- name of chart to use for calculation of the Mayer multiple (default value is BLX)
ملاحظات الأخبار
- Added the alert conditions. Remember: the alertcondition statement does not start alerts but creates the conditions. The alerts must always be created manually in the Create Alert dialog box.
- Changed the precision of graph (from 2 to 4).
ملاحظات الأخبار
Modified the title script.ملاحظات الأخبار
- Modified the alert conditions name.
- The Mayer multiple's graph is now plotted in another panel.
ملاحظات الأخبار
Improved the code readability.نص برمجي مفتوح المصدر
بروح TradingView الحقيقية، قام مبتكر هذا النص البرمجي بجعله مفتوح المصدر، بحيث يمكن للمتداولين مراجعة وظائفه والتحقق منها. شكرا للمؤلف! بينما يمكنك استخدامه مجانًا، تذكر أن إعادة نشر الكود يخضع لقواعد الموقع الخاصة بنا.
إخلاء المسؤولية
لا يُقصد بالمعلومات والمنشورات أن تكون، أو تشكل، أي نصيحة مالية أو استثمارية أو تجارية أو أنواع أخرى من النصائح أو التوصيات المقدمة أو المعتمدة من TradingView. اقرأ المزيد في شروط الاستخدام.
نص برمجي مفتوح المصدر
بروح TradingView الحقيقية، قام مبتكر هذا النص البرمجي بجعله مفتوح المصدر، بحيث يمكن للمتداولين مراجعة وظائفه والتحقق منها. شكرا للمؤلف! بينما يمكنك استخدامه مجانًا، تذكر أن إعادة نشر الكود يخضع لقواعد الموقع الخاصة بنا.
إخلاء المسؤولية
لا يُقصد بالمعلومات والمنشورات أن تكون، أو تشكل، أي نصيحة مالية أو استثمارية أو تجارية أو أنواع أخرى من النصائح أو التوصيات المقدمة أو المعتمدة من TradingView. اقرأ المزيد في شروط الاستخدام.