OPEN-SOURCE SCRIPT
[A618] VWAP bands for any Security
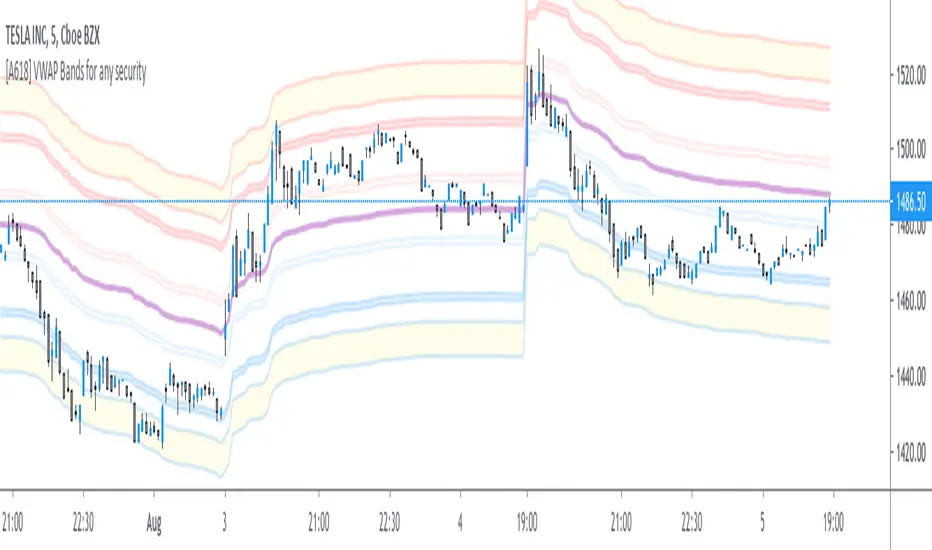
The Script plots Standard Deviation Bands around The VWAP line,
This will help you out with detecting market overbought and oversold Conditions on the Fly
Use this in conjunction with an oscillator
- stoch, macd, etc...
- if you find a positive crossover with oscillator on a VWAP level its time to go long, targeting the next vwap level and vice-versa
This will help you out with detecting market overbought and oversold Conditions on the Fly
Use this in conjunction with an oscillator
- stoch, macd, etc...
- if you find a positive crossover with oscillator on a VWAP level its time to go long, targeting the next vwap level and vice-versa
نص برمجي مفتوح المصدر
بروح TradingView الحقيقية، قام مبتكر هذا النص البرمجي بجعله مفتوح المصدر، بحيث يمكن للمتداولين مراجعة وظائفه والتحقق منها. شكرا للمؤلف! بينما يمكنك استخدامه مجانًا، تذكر أن إعادة نشر الكود يخضع لقواعد الموقع الخاصة بنا.
Get Ocs Ai Trader, Your personal Ai Trade Assistant here
→ ocstrader.com
About me
AlgoTrading Certification, ( University of Oxford, Säid Business School )
PGP Research Analysis, ( NISM, SEBI )
Electronics Engineer
→ ocstrader.com
About me
AlgoTrading Certification, ( University of Oxford, Säid Business School )
PGP Research Analysis, ( NISM, SEBI )
Electronics Engineer
إخلاء المسؤولية
لا يُقصد بالمعلومات والمنشورات أن تكون، أو تشكل، أي نصيحة مالية أو استثمارية أو تجارية أو أنواع أخرى من النصائح أو التوصيات المقدمة أو المعتمدة من TradingView. اقرأ المزيد في شروط الاستخدام.