OPEN-SOURCE SCRIPT
تم تحديثه High/Low last 1-3 candles

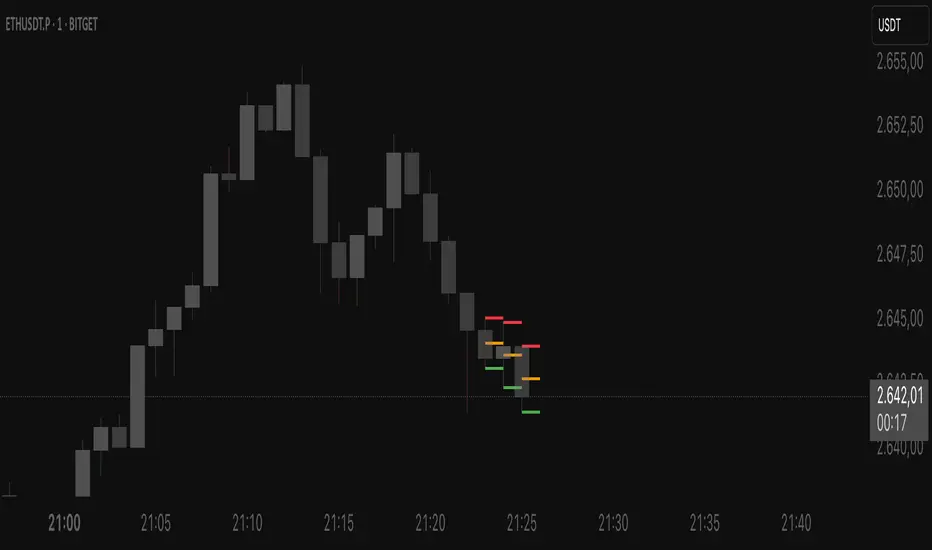
Here you can display the high and low of the last 1, 2 or 3 candles. The whole thing is updated with every new candle. you can also switch the lines on or off as you wish and adjust the colour of the lines. have fun with it
ملاحظات الأخبار
Dynamic Candle Levels — High/Low & 50% Lines LiveThis indicator dynamically visualizes the key price levels of the current and recent candles in real-time.
Automatically draws lines at the highs and lows of the last X candles
Marks the 50% level of each candle with horizontal lines
Updates the lines of the currently forming candle live as high, low, and midpoint change
Fully customizable colors, line widths, and number of displayed candles
Perfect for quickly identifying support and resistance zones or intermediate levels at a glance to make faster trading decisions.
Settings:
Number of candles for high/low and 50% lines
Colors and widths of the lines
Option to show live lines for the current candle
نص برمجي مفتوح المصدر
بروح TradingView الحقيقية، قام مبتكر هذا النص البرمجي بجعله مفتوح المصدر، بحيث يمكن للمتداولين مراجعة وظائفه والتحقق منها. شكرا للمؤلف! بينما يمكنك استخدامه مجانًا، تذكر أن إعادة نشر الكود يخضع لقواعد الموقع الخاصة بنا.
إخلاء المسؤولية
لا يُقصد بالمعلومات والمنشورات أن تكون، أو تشكل، أي نصيحة مالية أو استثمارية أو تجارية أو أنواع أخرى من النصائح أو التوصيات المقدمة أو المعتمدة من TradingView. اقرأ المزيد في شروط الاستخدام.