OPEN-SOURCE SCRIPT
تم تحديثه Pickledeggtradermans RSI MA
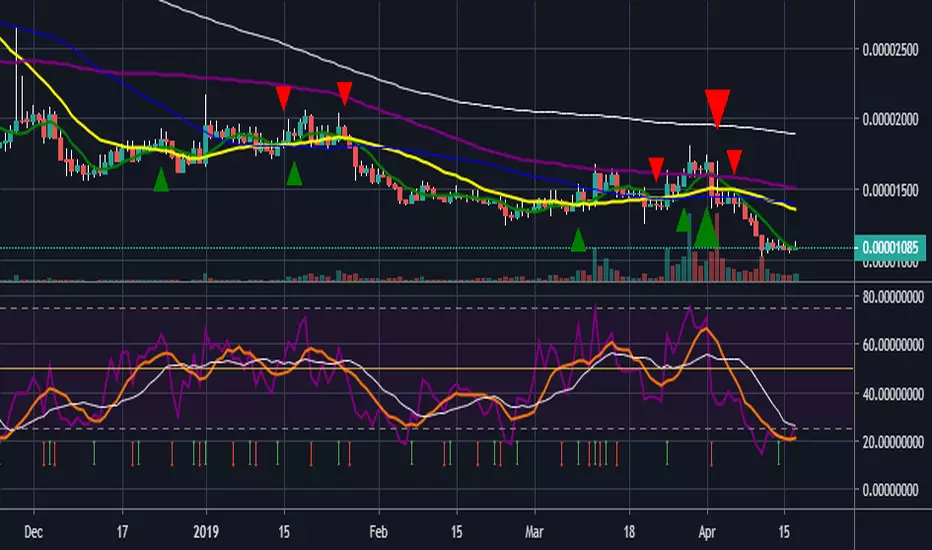
Hey guys just published another script that allows you to plot 3 sma's onto the RSI chart. Firstly the RSI close input is set to 7. the first sma is set at one in purple which is the current RSI level. Second MA is set at 7 and in orange, third and fourth ma's set to 14 and 21 in white and green respectively. Overbought/Oversold levels set at 75/25 with a midline at 50. These can all be tweaked to your liking. Enjoy
ملاحظات الأخبار
added an arrow indicator that shows when the rsi 7ma crosses over the rsi 1ma. Although this seems to slightly lag the cross i will be working to update the script to publish the arrows as soon as the cross happens when i get a little time to figure it out. Enjoyنص برمجي مفتوح المصدر
بروح TradingView الحقيقية، قام مبتكر هذا النص البرمجي بجعله مفتوح المصدر، بحيث يمكن للمتداولين مراجعة وظائفه والتحقق منها. شكرا للمؤلف! بينما يمكنك استخدامه مجانًا، تذكر أن إعادة نشر الكود يخضع لقواعد الموقع الخاصة بنا.
إخلاء المسؤولية
لا يُقصد بالمعلومات والمنشورات أن تكون، أو تشكل، أي نصيحة مالية أو استثمارية أو تجارية أو أنواع أخرى من النصائح أو التوصيات المقدمة أو المعتمدة من TradingView. اقرأ المزيد في شروط الاستخدام.
نص برمجي مفتوح المصدر
بروح TradingView الحقيقية، قام مبتكر هذا النص البرمجي بجعله مفتوح المصدر، بحيث يمكن للمتداولين مراجعة وظائفه والتحقق منها. شكرا للمؤلف! بينما يمكنك استخدامه مجانًا، تذكر أن إعادة نشر الكود يخضع لقواعد الموقع الخاصة بنا.
إخلاء المسؤولية
لا يُقصد بالمعلومات والمنشورات أن تكون، أو تشكل، أي نصيحة مالية أو استثمارية أو تجارية أو أنواع أخرى من النصائح أو التوصيات المقدمة أو المعتمدة من TradingView. اقرأ المزيد في شروط الاستخدام.