OPEN-SOURCE SCRIPT
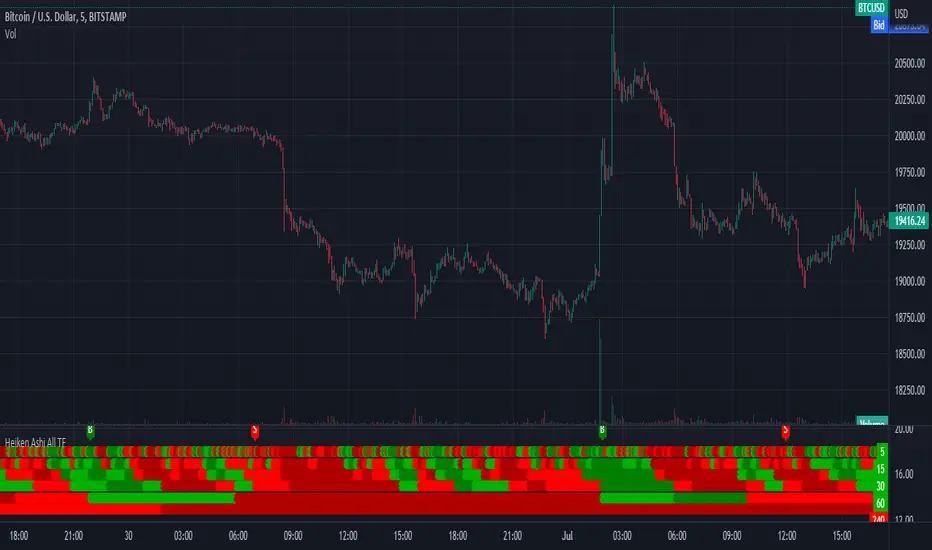
Heiken Ashi All TF

I have always fighted to understand the market direction because it looks different on different timeframes.
I wanted an indicator where I can see all the different timeframes at once.
This indicator shows the Heiken Ashi candle colors for different time frames at once.
Use it on the 5 Minute timeframe.
4 colors:
dark green: bullis green HA candle with no low shadow.
green: green HA candle.
red: red HA candle
datk red: bearish red HA candle with non existing upper shadow.
the timeframes are by default:
5m 15m 30m 1H 4H 1D
can be adjusted if needed.
signals:
in the top line the Buy / Shell Signals are shown when the selected timeframes are all changed.
for example after a buy signal a sell signal will be printend when all the selected timeframes are turned into red or dark red.
Do not use it as a tranding signal, us it for confirmation.
It doesn't predict. it shows the market's current state.
Don't forget that the latest candles are based on the current value. The higher timeframe candle color depends on the current price.
If the higher timeframe close price so different that the HA candle color changes it reprins for all the affected 5m dots.
نص برمجي مفتوح المصدر
بروح TradingView الحقيقية، قام مبتكر هذا النص البرمجي بجعله مفتوح المصدر، بحيث يمكن للمتداولين مراجعة وظائفه والتحقق منها. شكرا للمؤلف! بينما يمكنك استخدامه مجانًا، تذكر أن إعادة نشر الكود يخضع لقواعد الموقع الخاصة بنا.
إخلاء المسؤولية
لا يُقصد بالمعلومات والمنشورات أن تكون، أو تشكل، أي نصيحة مالية أو استثمارية أو تجارية أو أنواع أخرى من النصائح أو التوصيات المقدمة أو المعتمدة من TradingView. اقرأ المزيد في شروط الاستخدام.