OPEN-SOURCE SCRIPT
Candle Volatility Index [by NicoadW]
This is the migration of the CandleVolatilitIndex from MT4.
The indicator works as following:
Step 1: The "Volatility Value" is calculated by applying a moving average to the change of the selected source (default: 10-Period-SMA applied to the change from last close to this close -> SMA(close-close[1] , 10) )
Step 2: The signal line is calculated by applying a moving average onto the "Volatility Value" calculated in step 1.
The default settings are the same as in the original MT4 version.
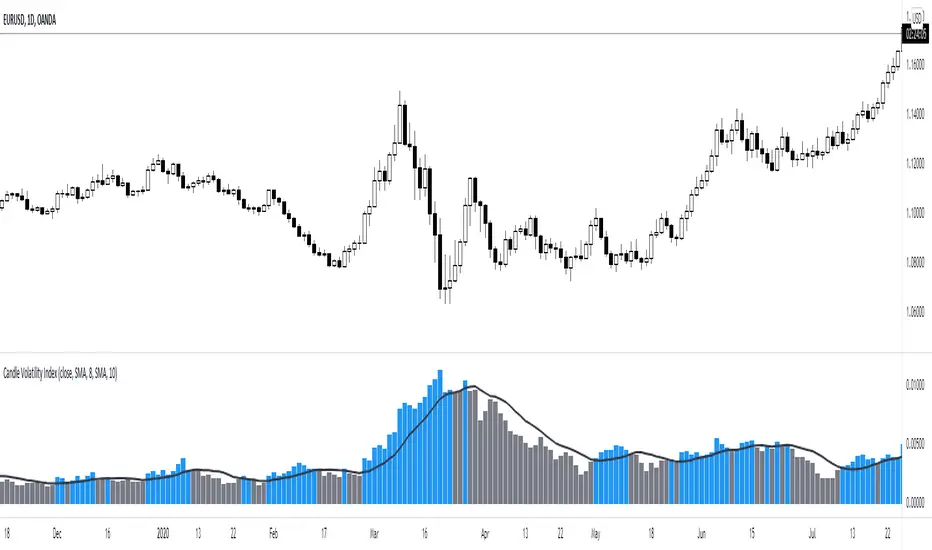
Visualization:
The histogram shows the "Volatility Value" calculated in step 1.
Case 1:
The value is above the signal line (blue bar) -> Volatility is given
Case 2:
The value is below the signal line (grey bar) -> Volatility is not there
This is intended to be used as a Volume/Volatility Indicator for a NNFX-System but can be used in any strategy.
The indicator works as following:
Step 1: The "Volatility Value" is calculated by applying a moving average to the change of the selected source (default: 10-Period-SMA applied to the change from last close to this close -> SMA(close-close[1] , 10) )
Step 2: The signal line is calculated by applying a moving average onto the "Volatility Value" calculated in step 1.
The default settings are the same as in the original MT4 version.
Visualization:
The histogram shows the "Volatility Value" calculated in step 1.
Case 1:
The value is above the signal line (blue bar) -> Volatility is given
Case 2:
The value is below the signal line (grey bar) -> Volatility is not there
This is intended to be used as a Volume/Volatility Indicator for a NNFX-System but can be used in any strategy.
نص برمجي مفتوح المصدر
بروح TradingView الحقيقية، قام مبتكر هذا النص البرمجي بجعله مفتوح المصدر، بحيث يمكن للمتداولين مراجعة وظائفه والتحقق منها. شكرا للمؤلف! بينما يمكنك استخدامه مجانًا، تذكر أن إعادة نشر الكود يخضع لقواعد الموقع الخاصة بنا.
إخلاء المسؤولية
لا يُقصد بالمعلومات والمنشورات أن تكون، أو تشكل، أي نصيحة مالية أو استثمارية أو تجارية أو أنواع أخرى من النصائح أو التوصيات المقدمة أو المعتمدة من TradingView. اقرأ المزيد في شروط الاستخدام.