OPEN-SOURCE SCRIPT
Vector Trinity III: Flow [CVD]
**1. Introduction: The Truth Serum**
This indicator is **Part 3** of the "Vector Trinity" trading system. It is the final validator in the decision-making process.
While Part I defines the *Structure* and Part II identifies the *Impulse*, **Part III (Flow)** answers the most critical question in trading: **"Is there real money behind this move?"**
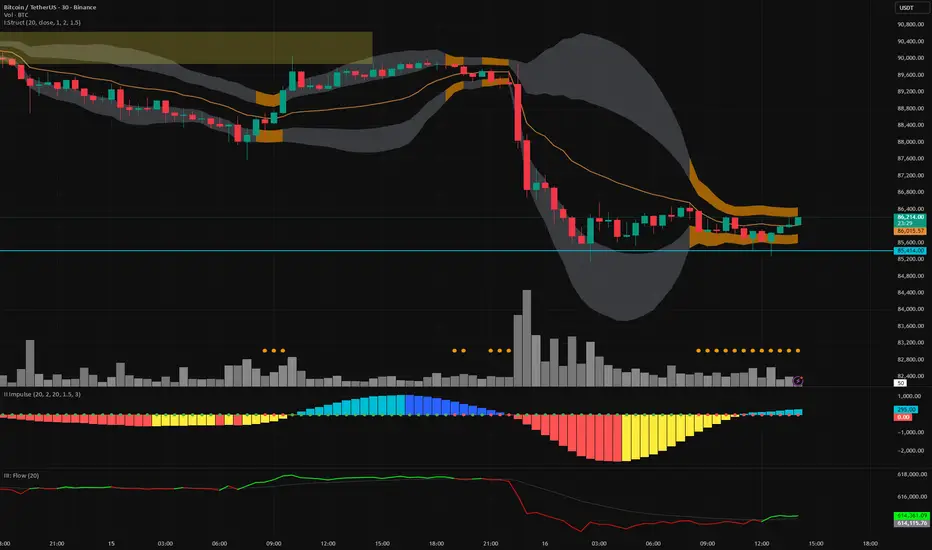
It represents the **Energy Dimension**, analyzing the Cumulative Volume Delta (CVD) to spot true breakouts and expose traps.
* **I: Structure:** Spatial boundaries.
* **II: Impulse:** Momentum timing.
* **III: Flow:** **Capital validation & Divergence detection (Current Indicator).**
**2. Core Logic: CVD Estimation**
True "Delta" requires tick-by-tick data, which is often unavailable or premium-locked. **Vector Trinity III** uses a sophisticated **Intrabar Position Estimation** algorithm to mathematically approximate buying vs. selling pressure:
* **The Math:** It analyzes where the Close sits relative to the High and Low of the candle.
* Close near High = Dominant Aggressive Buying.
* Close near Low = Dominant Aggressive Selling.
* **The CVD:** It accumulates these delta values over time to create a continuous "Flow" line. This reveals the long-term intent of smart money.
**3. The Trend Line & Divergence**
The indicator features a **Grey Trend Line** (EMA of CVD) which serves as the baseline for "Net Flow."
* **Teal Zone (Above Trend):** Net Inflow. Capital is aggressively entering the market, supporting the price.
* **Maroon Zone (Below Trend):** Net Outflow. Capital is leaving the market, suggesting weakness.
**4. The "Trap" Detector (Divergence)**
The primary superpower of this indicator is spotting **Divergences**:
* **The Bull Trap (Fakeout):** Price makes a Higher High, but CVD makes a Lower High (or trends down).
* *Meaning:* The price is rising due to a lack of liquidity, not aggressive buying. **Smart money is selling into the rally.**
* **The Bear Trap (Shakeout):** Price makes a Lower Low, but CVD makes a Higher Low.
* *Meaning:* Smart money is absorbing the selling pressure (buying the dip).
**5. How to Use**
* **The "Trinity" Confirmation:** Before taking a trade based on Part I (Structure) and Part II (Impulse), look at Part III.
* **For a Long Setup:**
1. Price breaks the Structure (Part I).
2. Momentum fires Green/Cyan (Part II).
3. **Flow (Part III) MUST be Teal and rising.**
* **The Veto Rule:** If Price breaks up, but Flow is Maroon/Falling, **CANCEL the trade**. It is likely a trap.
**Settings:**
* **Trend Length:** 20 (Standard trend baseline to determine Net Inflow/Outflow).
---
### **中文说明**
**1. 简介:市场的“测谎仪”**
本指标是“矢量三位一体”交易系统的 **第三部分**。它是决策过程中最后的验证者。
第一部分 (Structure) 定义了结构,第二部分 (Impulse) 识别了脉冲,而 **第三部分 (Flow)** 则回答了交易中最关键的问题:**“这波行情背后有真钱吗?”**
它代表了系统的 **能量维度**,通过分析累积成交量 Delta (CVD) 来识别真正的突破并揭露市场陷阱。
* **I: Structure 结构:** 空间边界。
* **II: Impulse 脉冲:** 动能时机。
* **III: Flow 流向:** **资金验证与背离侦测(本指标)。**
**2. 核心逻辑:CVD 估算算法**
真正的“Delta”数据通常需要逐笔成交数据 (Tick Data),这往往需要付费数据源。**Vector Trinity III** 使用了一套精密的 **K线内相对位置估算 (Intrabar Position Estimation)** 算法,在数学上逼近真实的买卖压力:
* **算法原理:** 它分析收盘价在 K 线最高价和最低价之间的相对位置。
* 收盘接近最高价 = 主动买入主导。
* 收盘接近最低价 = 主动卖出主导。
* **CVD (累积值):** 它将这些 Delta 值随时间累积,形成一条连续的“资金流向”线。这揭示了主力资金的长期意图。
**3. 趋势线与背离**
指标包含一条 **灰色趋势线** (CVD 的均线),作为“净流量”的基准。
* **青色区域 (趋势线上方):** 净流入。资金正在积极入场,支撑价格上涨。
* **深红区域 (趋势线下方):** 净流出。资金正在撤离市场,暗示行情虚弱。
**4. “陷阱”侦测器 (背离)**
本指标的核心超能力是识别 **背离 (Divergence)**:
* **多头陷阱 (诱多/假突破):** 价格创出新高,但 CVD 却创出新低(或趋势向下)。
* *含义:* 价格上涨是因为缺乏流动性(空涨),而不是因为有主动买盘。**主力资金正在借反弹出货。**
* **空头陷阱 (诱空/洗盘):** 价格创出新低,但 CVD 却在抬高。
* *含义:* 主力资金正在吸收抛压(在此位置吸筹)。
**5. 使用方法**
* **“三位一体”共振验证:** 在根据第一部分 (结构) 和第二部分 (脉冲) 开单之前,必须查看第三部分。
* **做多设置:**
1. 价格突破结构 (Part I)。
2. 动能点火变绿/青色 (Part II)。
3. **资金流 (Part III) 必须呈现青色且向上攀升。**
* **一票否决权:** 如果价格向上突破,但资金流是深红色/下降的,**立即取消交易**。这极大概率是一个陷阱。
**参数设置:**
* **Trend Length (趋势周期):** 20 (用于确定净流入/流出的标准基准线)。
This indicator is **Part 3** of the "Vector Trinity" trading system. It is the final validator in the decision-making process.
While Part I defines the *Structure* and Part II identifies the *Impulse*, **Part III (Flow)** answers the most critical question in trading: **"Is there real money behind this move?"**
It represents the **Energy Dimension**, analyzing the Cumulative Volume Delta (CVD) to spot true breakouts and expose traps.
* **I: Structure:** Spatial boundaries.
* **II: Impulse:** Momentum timing.
* **III: Flow:** **Capital validation & Divergence detection (Current Indicator).**
**2. Core Logic: CVD Estimation**
True "Delta" requires tick-by-tick data, which is often unavailable or premium-locked. **Vector Trinity III** uses a sophisticated **Intrabar Position Estimation** algorithm to mathematically approximate buying vs. selling pressure:
* **The Math:** It analyzes where the Close sits relative to the High and Low of the candle.
* Close near High = Dominant Aggressive Buying.
* Close near Low = Dominant Aggressive Selling.
* **The CVD:** It accumulates these delta values over time to create a continuous "Flow" line. This reveals the long-term intent of smart money.
**3. The Trend Line & Divergence**
The indicator features a **Grey Trend Line** (EMA of CVD) which serves as the baseline for "Net Flow."
* **Teal Zone (Above Trend):** Net Inflow. Capital is aggressively entering the market, supporting the price.
* **Maroon Zone (Below Trend):** Net Outflow. Capital is leaving the market, suggesting weakness.
**4. The "Trap" Detector (Divergence)**
The primary superpower of this indicator is spotting **Divergences**:
* **The Bull Trap (Fakeout):** Price makes a Higher High, but CVD makes a Lower High (or trends down).
* *Meaning:* The price is rising due to a lack of liquidity, not aggressive buying. **Smart money is selling into the rally.**
* **The Bear Trap (Shakeout):** Price makes a Lower Low, but CVD makes a Higher Low.
* *Meaning:* Smart money is absorbing the selling pressure (buying the dip).
**5. How to Use**
* **The "Trinity" Confirmation:** Before taking a trade based on Part I (Structure) and Part II (Impulse), look at Part III.
* **For a Long Setup:**
1. Price breaks the Structure (Part I).
2. Momentum fires Green/Cyan (Part II).
3. **Flow (Part III) MUST be Teal and rising.**
* **The Veto Rule:** If Price breaks up, but Flow is Maroon/Falling, **CANCEL the trade**. It is likely a trap.
**Settings:**
* **Trend Length:** 20 (Standard trend baseline to determine Net Inflow/Outflow).
---
### **中文说明**
**1. 简介:市场的“测谎仪”**
本指标是“矢量三位一体”交易系统的 **第三部分**。它是决策过程中最后的验证者。
第一部分 (Structure) 定义了结构,第二部分 (Impulse) 识别了脉冲,而 **第三部分 (Flow)** 则回答了交易中最关键的问题:**“这波行情背后有真钱吗?”**
它代表了系统的 **能量维度**,通过分析累积成交量 Delta (CVD) 来识别真正的突破并揭露市场陷阱。
* **I: Structure 结构:** 空间边界。
* **II: Impulse 脉冲:** 动能时机。
* **III: Flow 流向:** **资金验证与背离侦测(本指标)。**
**2. 核心逻辑:CVD 估算算法**
真正的“Delta”数据通常需要逐笔成交数据 (Tick Data),这往往需要付费数据源。**Vector Trinity III** 使用了一套精密的 **K线内相对位置估算 (Intrabar Position Estimation)** 算法,在数学上逼近真实的买卖压力:
* **算法原理:** 它分析收盘价在 K 线最高价和最低价之间的相对位置。
* 收盘接近最高价 = 主动买入主导。
* 收盘接近最低价 = 主动卖出主导。
* **CVD (累积值):** 它将这些 Delta 值随时间累积,形成一条连续的“资金流向”线。这揭示了主力资金的长期意图。
**3. 趋势线与背离**
指标包含一条 **灰色趋势线** (CVD 的均线),作为“净流量”的基准。
* **青色区域 (趋势线上方):** 净流入。资金正在积极入场,支撑价格上涨。
* **深红区域 (趋势线下方):** 净流出。资金正在撤离市场,暗示行情虚弱。
**4. “陷阱”侦测器 (背离)**
本指标的核心超能力是识别 **背离 (Divergence)**:
* **多头陷阱 (诱多/假突破):** 价格创出新高,但 CVD 却创出新低(或趋势向下)。
* *含义:* 价格上涨是因为缺乏流动性(空涨),而不是因为有主动买盘。**主力资金正在借反弹出货。**
* **空头陷阱 (诱空/洗盘):** 价格创出新低,但 CVD 却在抬高。
* *含义:* 主力资金正在吸收抛压(在此位置吸筹)。
**5. 使用方法**
* **“三位一体”共振验证:** 在根据第一部分 (结构) 和第二部分 (脉冲) 开单之前,必须查看第三部分。
* **做多设置:**
1. 价格突破结构 (Part I)。
2. 动能点火变绿/青色 (Part II)。
3. **资金流 (Part III) 必须呈现青色且向上攀升。**
* **一票否决权:** 如果价格向上突破,但资金流是深红色/下降的,**立即取消交易**。这极大概率是一个陷阱。
**参数设置:**
* **Trend Length (趋势周期):** 20 (用于确定净流入/流出的标准基准线)。
نص برمجي مفتوح المصدر
بروح TradingView الحقيقية، قام مبتكر هذا النص البرمجي بجعله مفتوح المصدر، بحيث يمكن للمتداولين مراجعة وظائفه والتحقق منها. شكرا للمؤلف! بينما يمكنك استخدامه مجانًا، تذكر أن إعادة نشر الكود يخضع لقواعد الموقع الخاصة بنا.
إخلاء المسؤولية
لا يُقصد بالمعلومات والمنشورات أن تكون، أو تشكل، أي نصيحة مالية أو استثمارية أو تجارية أو أنواع أخرى من النصائح أو التوصيات المقدمة أو المعتمدة من TradingView. اقرأ المزيد في شروط الاستخدام.