Gold Spotter
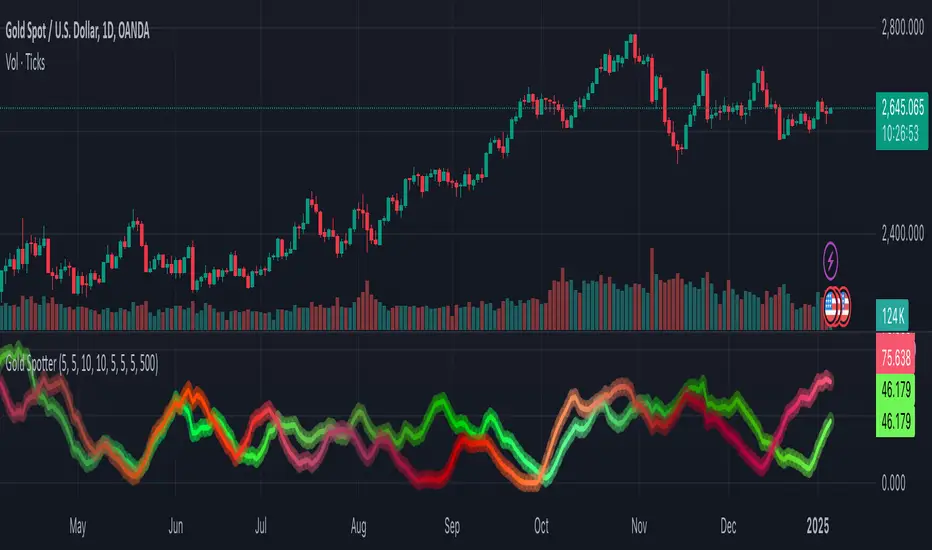
Two “Baskets” of Data
The script constructs two composite values (one green, one red) by fetching certain currency-related data in the background. Each composite is normalized over a lookback period so both lines map into a 0–100 range.
Weighting by Another Security’s Trend
A ratio is calculated from the chart’s own price vs. its moving average. That ratio is raised to a specified “power” (configured by the user), then used to scale each composite. This means if the price is above its average, both lines can be inflated; if below, both lines can be suppressed.
What the Lines Represent
Green Line: Represents a “pegged basket” index. (A small group of instruments that historically move in a certain way relative to Gold.)
Red Line: Represents an “exotics basket” index. (A different group of instruments that also has a meaningful relationship to Gold.)
What Is It Predicting
By measuring hidden relationships between these two baskets and weighting them by the chart’s trend, the green/red lines often provide an early read on which direction Gold might take next usually leading by 3-7 days.
نص برمجي للمستخدمين المدعوين فقط
يمكن فقط للمستخدمين الذين تمت الموافقة عليهم من قبل المؤلف الوصول إلى هذا البرنامج النصي. ستحتاج إلى طلب الإذن والحصول عليه لاستخدامه. يتم منح هذا عادةً بعد الدفع. لمزيد من التفاصيل، اتبع تعليمات المؤلف أدناه أو اتصل ب JoeTheGoldTrader مباشرة.
تجدر الإشارة إلى أن هذا النص البرمجي الخاص والموجه بدعوة فقط لم تتم مراجعته من قبل المشرفين على النص البرمجي، كما أن امتثاله للقواعد الداخلية غير محدد. لا توصي TradingView بالدفع مقابل برنامج نصي أو استخدامه إلا إذا كنت تثق تمامًا في مؤلفه وتفهم كيفية عمله. يمكنك أيضًا العثور على بدائل مجانية ومفتوحة المصدر في نصوص مجتمعنا.
تعليمات المؤلف
إخلاء المسؤولية
نص برمجي للمستخدمين المدعوين فقط
يمكن فقط للمستخدمين الذين تمت الموافقة عليهم من قبل المؤلف الوصول إلى هذا البرنامج النصي. ستحتاج إلى طلب الإذن والحصول عليه لاستخدامه. يتم منح هذا عادةً بعد الدفع. لمزيد من التفاصيل، اتبع تعليمات المؤلف أدناه أو اتصل ب JoeTheGoldTrader مباشرة.
تجدر الإشارة إلى أن هذا النص البرمجي الخاص والموجه بدعوة فقط لم تتم مراجعته من قبل المشرفين على النص البرمجي، كما أن امتثاله للقواعد الداخلية غير محدد. لا توصي TradingView بالدفع مقابل برنامج نصي أو استخدامه إلا إذا كنت تثق تمامًا في مؤلفه وتفهم كيفية عمله. يمكنك أيضًا العثور على بدائل مجانية ومفتوحة المصدر في نصوص مجتمعنا.