PROTECTED SOURCE SCRIPT
IA Free
Initiative Analysis (IA) is a concept of visual market analysis based on the idea that every price move is formed by the interaction of two forces — buyers and sellers.
The method structures price movements into a clear system of initiatives and reactions, helping you act with logic.
IA helps you see who is taking initiative, where the key levels and interest zones of both sides are, and where the balance of power may shift.
💡 How the method works
IA focuses on known price ranges — the areas where buyer or seller activity has previously appeared.
These ranges show the balance of power: this is where moves started, reactions happened, and initiative shifted.
Within these ranges, the method makes a forecast — identifying which side is now taking control (buyers or sellers) and calculating the target area for the potential move.
The goal of the method is to simplify analysis while keeping the full context, so traders and investors can see the logic behind market movement.
The method works for both short-term trading and long-term investing.
________________________________________
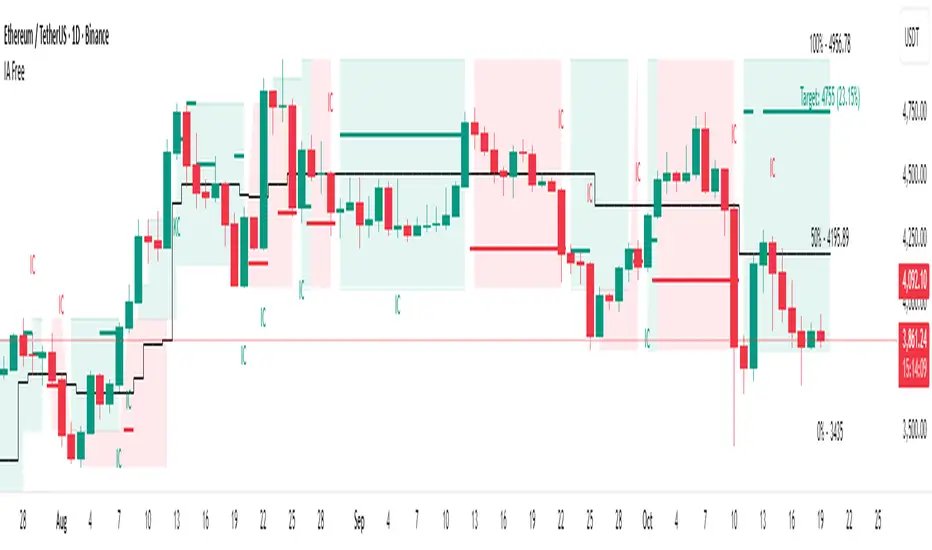
IA Free — Visualization of the Initiative Analysis Method
IA Free forecasts initiative on the market: which side — buyers or sellers — will take control, and calculates the target price for the potential move.
Each initiative has a beginning and an end — both in time and in price.
The indicator defines the upper and lower boundaries of the initiative, which serve as key contextual reference points for further analysis.
Forecasted initiatives are displayed on the chart and remain visible even if the move does not play out.
This allows you to:
• see when conditions for an initiative shift appeared;
• define possible correction levels.
________________________________________
Main Visualization Elements

• Buyer and seller initiative zones — show who is in control and define the upper and lower boundaries of each initiative on the chart.
• Target levels — projected direction of movement.
• Key candles (KC, IC) — candles with the highest volume inside an initiative.
KC — candle with the highest volume inside a trending initiative. Determined only after the initiative is formed and remains unchanged thereafter.
IC — candle with the highest volume inside a sideways initiative. It may change within the initiative: each new candle with higher volume inside the same initiative becomes the new IC.
• Internal range levels — the inner structure of an initiative (five adjustable user-defined levels).
You can customize the elements:
• show or hide initiative zones and targets;
• change line thickness and background transparency;
• select colors for dark or light chart themes.
________________________________________
Highlighted Settings (focus points)
• Include sideways markets in the analysis — includes ranges in initiative analysis (enabled by default).
• Sideways market activation point — the number of points after which the market is recognized as sideways (default: 4; values 6–7 filter out minor consolidations).
• Color parameters — allow you to adjust visuals for your style and chart theme.
________________________________________
Market Structure in IA

IA helps visualize three key phases of the market:
• Trend — one side dominates. On the chart, consecutive initiatives of the same color represent a continuation of the same side’s control.
• Range — balance of power; on the chart, initiatives alternate within a limited price range that may gradually expand.
• Transitional — shift of initiative and the start of a new move. On the chart within one time interval, there are two initiatives: the buyer’s initiative appears above, and the seller’s initiative appears below.
________________________________________
5 Steps for Working with IA Free
1. Identify the initiative — buyers or sellers: who controls the market and where the move is heading.
2. Check the higher timeframe context — make sure the higher timeframe doesn’t contradict the initiative on the lower one.
3. Confirm initiative strength — look for wide candles with volume, absorptions, and protection of initiative edges.
4. Define your entry trigger — retest, false breakout, KC/IC reaction, candle pattern, or your own system signal.
5. Manage risks — When trading with leverage, a stop-loss is mandatory! Define stop-loss placement according to your system (for example, beyond the initiative’s border), take profits near the target, and manage the trade following market structure.
________________________________________
Practice and Testing
Test your ideas on historical data: observe how initiatives and targets played out, how initiative edges were defended (candle patterns), and how price reacted when returning to KC/IC candles.
This helps you develop a clear understanding of market logic and confidence in decision-making.
________________________________________
Limitations
• Displays initiatives and targets only on the selected chart timeframe.
• Some IA method elements — such as internal buyer/seller zones or false breakout pattern recognition — are not implemented.
• Platform functions for alerts and data output (for custom algo strategies) are not supported.
The method structures price movements into a clear system of initiatives and reactions, helping you act with logic.
IA helps you see who is taking initiative, where the key levels and interest zones of both sides are, and where the balance of power may shift.
💡 How the method works
IA focuses on known price ranges — the areas where buyer or seller activity has previously appeared.
These ranges show the balance of power: this is where moves started, reactions happened, and initiative shifted.
Within these ranges, the method makes a forecast — identifying which side is now taking control (buyers or sellers) and calculating the target area for the potential move.
The goal of the method is to simplify analysis while keeping the full context, so traders and investors can see the logic behind market movement.
The method works for both short-term trading and long-term investing.
________________________________________
IA Free — Visualization of the Initiative Analysis Method
IA Free forecasts initiative on the market: which side — buyers or sellers — will take control, and calculates the target price for the potential move.
Each initiative has a beginning and an end — both in time and in price.
The indicator defines the upper and lower boundaries of the initiative, which serve as key contextual reference points for further analysis.
Forecasted initiatives are displayed on the chart and remain visible even if the move does not play out.
This allows you to:
• see when conditions for an initiative shift appeared;
• define possible correction levels.
________________________________________
Main Visualization Elements
• Buyer and seller initiative zones — show who is in control and define the upper and lower boundaries of each initiative on the chart.
• Target levels — projected direction of movement.
• Key candles (KC, IC) — candles with the highest volume inside an initiative.
KC — candle with the highest volume inside a trending initiative. Determined only after the initiative is formed and remains unchanged thereafter.
IC — candle with the highest volume inside a sideways initiative. It may change within the initiative: each new candle with higher volume inside the same initiative becomes the new IC.
• Internal range levels — the inner structure of an initiative (five adjustable user-defined levels).
You can customize the elements:
• show or hide initiative zones and targets;
• change line thickness and background transparency;
• select colors for dark or light chart themes.
________________________________________
Highlighted Settings (focus points)
• Include sideways markets in the analysis — includes ranges in initiative analysis (enabled by default).
• Sideways market activation point — the number of points after which the market is recognized as sideways (default: 4; values 6–7 filter out minor consolidations).
• Color parameters — allow you to adjust visuals for your style and chart theme.
________________________________________
Market Structure in IA
IA helps visualize three key phases of the market:
• Trend — one side dominates. On the chart, consecutive initiatives of the same color represent a continuation of the same side’s control.
• Range — balance of power; on the chart, initiatives alternate within a limited price range that may gradually expand.
• Transitional — shift of initiative and the start of a new move. On the chart within one time interval, there are two initiatives: the buyer’s initiative appears above, and the seller’s initiative appears below.
________________________________________
5 Steps for Working with IA Free
1. Identify the initiative — buyers or sellers: who controls the market and where the move is heading.
2. Check the higher timeframe context — make sure the higher timeframe doesn’t contradict the initiative on the lower one.
3. Confirm initiative strength — look for wide candles with volume, absorptions, and protection of initiative edges.
4. Define your entry trigger — retest, false breakout, KC/IC reaction, candle pattern, or your own system signal.
5. Manage risks — When trading with leverage, a stop-loss is mandatory! Define stop-loss placement according to your system (for example, beyond the initiative’s border), take profits near the target, and manage the trade following market structure.
________________________________________
Practice and Testing
Test your ideas on historical data: observe how initiatives and targets played out, how initiative edges were defended (candle patterns), and how price reacted when returning to KC/IC candles.
This helps you develop a clear understanding of market logic and confidence in decision-making.
________________________________________
Limitations
• Displays initiatives and targets only on the selected chart timeframe.
• Some IA method elements — such as internal buyer/seller zones or false breakout pattern recognition — are not implemented.
• Platform functions for alerts and data output (for custom algo strategies) are not supported.
نص برمجي محمي
تم نشر هذا النص البرمجي كمصدر مغلق. ومع ذلك، يمكنك استخدامه بحرية ودون أي قيود - تعرف على المزيد هنا.
Рыночные сценарии, инструкция к индикатору, практические примеры — t.me/ialogic
Market scenarios, indicator guide, practical examples — t.me/initiativeanalysis
Clarity on the Chart. Smart Trading Decisions
Market scenarios, indicator guide, practical examples — t.me/initiativeanalysis
Clarity on the Chart. Smart Trading Decisions
إخلاء المسؤولية
لا يُقصد بالمعلومات والمنشورات أن تكون، أو تشكل، أي نصيحة مالية أو استثمارية أو تجارية أو أنواع أخرى من النصائح أو التوصيات المقدمة أو المعتمدة من TradingView. اقرأ المزيد في شروط الاستخدام.