OPEN-SOURCE SCRIPT
Buy/Sell Volume Totals for Period

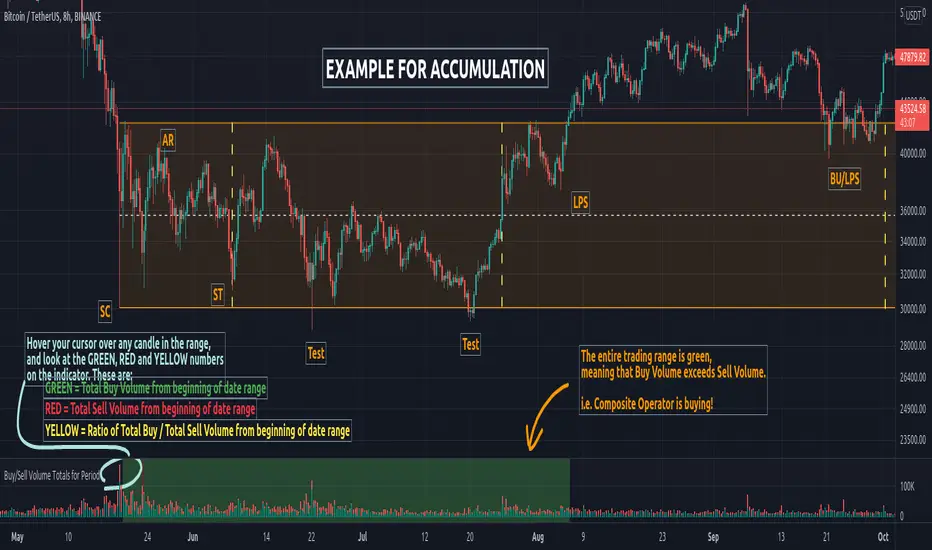
This indicator can be used to help you tell the difference between Wyckoff Accumulation and Distribution.
The idea is to add up all the Buy Volume and all the Sell Volume separately from the beginning of the Trading Range (TR) for each candle. You can define the Start and End dates in the settings of the indicator.
The indicator will show you 3 numbers of interest:
When the Total Buy Volume exceeds the Total Sell Volume in the TR, the indicator will color the background in GREEN color, to indicate possible accumulation. Otherwise the background will be RED, to indicate possible distribution.
You can float your cursor over any candle to see the current Volume Totals at that candle from the beginning of the TR (set by you in settings to a specific date).
Here's a few examples of the indicator in action:
1) Accumulation

2) Distribution

3) Possible Re-distribution

Please note that this indicator is meant to be used in combination with other analysis techniques from the Wyckoff Methodology!
The idea is to add up all the Buy Volume and all the Sell Volume separately from the beginning of the Trading Range (TR) for each candle. You can define the Start and End dates in the settings of the indicator.
The indicator will show you 3 numbers of interest:
- GREEN = Total Buy Volume from beginning of date range
- RED = Total Sell Volume from beginning of date range
- YELLOW = Ratio of Total Buy / Total Sell Volume from beginning of date range
When the Total Buy Volume exceeds the Total Sell Volume in the TR, the indicator will color the background in GREEN color, to indicate possible accumulation. Otherwise the background will be RED, to indicate possible distribution.
You can float your cursor over any candle to see the current Volume Totals at that candle from the beginning of the TR (set by you in settings to a specific date).
Here's a few examples of the indicator in action:
1) Accumulation
2) Distribution
3) Possible Re-distribution
Please note that this indicator is meant to be used in combination with other analysis techniques from the Wyckoff Methodology!
نص برمجي مفتوح المصدر
بروح TradingView الحقيقية، قام مبتكر هذا النص البرمجي بجعله مفتوح المصدر، بحيث يمكن للمتداولين مراجعة وظائفه والتحقق منها. شكرا للمؤلف! بينما يمكنك استخدامه مجانًا، تذكر أن إعادة نشر الكود يخضع لقواعد الموقع الخاصة بنا.
إخلاء المسؤولية
لا يُقصد بالمعلومات والمنشورات أن تكون، أو تشكل، أي نصيحة مالية أو استثمارية أو تجارية أو أنواع أخرى من النصائح أو التوصيات المقدمة أو المعتمدة من TradingView. اقرأ المزيد في شروط الاستخدام.