OPEN-SOURCE SCRIPT
تم تحديثه Roger & Satchell Estimator Historical Volatility Bands [Loxx]
Roger & Satchell Estimator Historical Volatility Bands [Loxx] are constructed using:
What is Roger & Satchell Estimator Historical Volatility?
The Rogers–Satchell estimator does not handle opening jumps; therefore, it underestimates the volatility. It accurately explains the volatility portion that can be attributed entirely to a trend in the price evolution. Rogers and Satchell try to embody the frequency of price observations in the model in order to overcome the drawback. They claim that the corrected estimator outperforms the uncorrected one in a study based on simulated data.
RSEHV = sqrt((Z/n) * sum((log(high/close)*log(high/open)) + (log(low/close)*log(low/open))))
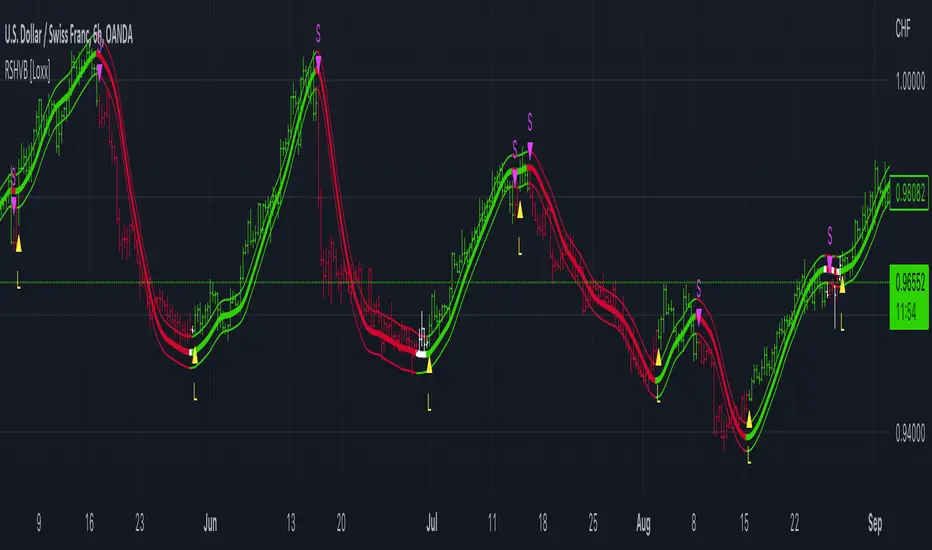
The color of the middle line, unlike the bands colors, has 3 colors. When colors of the bands are the same, then the middle line has the same color, otherwise it's white.
Included
- Average as the middle line.
- Upper and lower bands using theRoger & Satchell Estimator Historical Volatility Bands for bands calculation.
What is Roger & Satchell Estimator Historical Volatility?
The Rogers–Satchell estimator does not handle opening jumps; therefore, it underestimates the volatility. It accurately explains the volatility portion that can be attributed entirely to a trend in the price evolution. Rogers and Satchell try to embody the frequency of price observations in the model in order to overcome the drawback. They claim that the corrected estimator outperforms the uncorrected one in a study based on simulated data.
RSEHV = sqrt((Z/n) * sum((log(high/close)*log(high/open)) + (log(low/close)*log(low/open))))
The color of the middle line, unlike the bands colors, has 3 colors. When colors of the bands are the same, then the middle line has the same color, otherwise it's white.
Included
- Alerts
- Signals
- Loxx's Expanded Source Types
- Bar coloring
ملاحظات الأخبار
Updated to handle all timeframes. This calculation is without annualized modification so that it's relevant to the current timeframe only.نص برمجي مفتوح المصدر
بروح TradingView الحقيقية، قام مبتكر هذا النص البرمجي بجعله مفتوح المصدر، بحيث يمكن للمتداولين مراجعة وظائفه والتحقق منها. شكرا للمؤلف! بينما يمكنك استخدامه مجانًا، تذكر أن إعادة نشر الكود يخضع لقواعد الموقع الخاصة بنا.
Public Telegram Group, t.me/algxtrading_public
VIP Membership Info: patreon.com/algxtrading/membership
VIP Membership Info: patreon.com/algxtrading/membership
إخلاء المسؤولية
لا يُقصد بالمعلومات والمنشورات أن تكون، أو تشكل، أي نصيحة مالية أو استثمارية أو تجارية أو أنواع أخرى من النصائح أو التوصيات المقدمة أو المعتمدة من TradingView. اقرأ المزيد في شروط الاستخدام.
نص برمجي مفتوح المصدر
بروح TradingView الحقيقية، قام مبتكر هذا النص البرمجي بجعله مفتوح المصدر، بحيث يمكن للمتداولين مراجعة وظائفه والتحقق منها. شكرا للمؤلف! بينما يمكنك استخدامه مجانًا، تذكر أن إعادة نشر الكود يخضع لقواعد الموقع الخاصة بنا.
Public Telegram Group, t.me/algxtrading_public
VIP Membership Info: patreon.com/algxtrading/membership
VIP Membership Info: patreon.com/algxtrading/membership
إخلاء المسؤولية
لا يُقصد بالمعلومات والمنشورات أن تكون، أو تشكل، أي نصيحة مالية أو استثمارية أو تجارية أو أنواع أخرى من النصائح أو التوصيات المقدمة أو المعتمدة من TradingView. اقرأ المزيد في شروط الاستخدام.