PROTECTED SOURCE SCRIPT
B&W HEATMAP
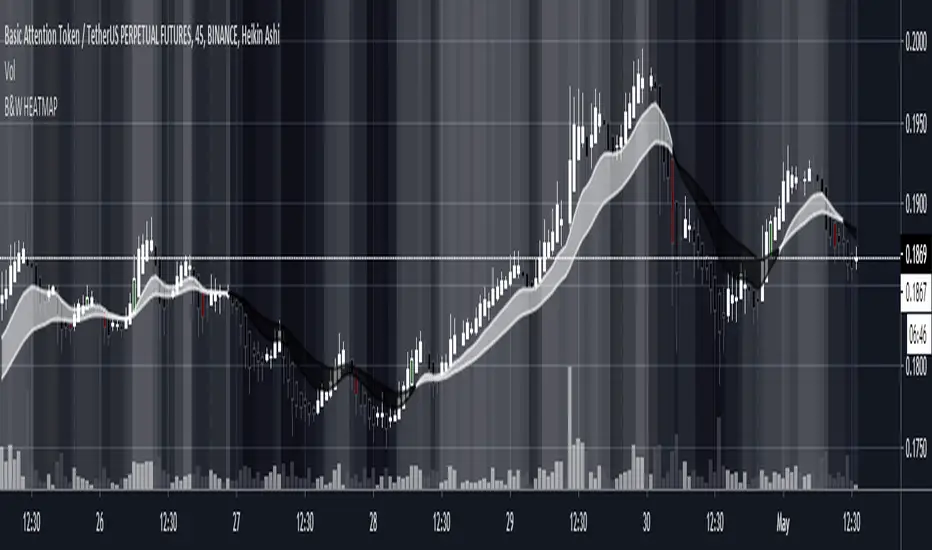
A Black and white heatmap (you can change to any colors in settings) overlay for better trend analysis. Use the crossovers to determine directional bias. Can be used with any other MA cross, baseline, or trendline strategies to help decide if a trade is worth taking. The gradient from black to white represent the strength of the trend . Black = Downtrend, White = Uptrend, Gray=range/chop. Candle colors indicate potential Long/Short
نص برمجي محمي
تم نشر هذا النص البرمجي كمصدر مغلق. ومع ذلك، يمكنك استخدامه بحرية ودون أي قيود - تعرف على المزيد هنا.
إخلاء المسؤولية
لا يُقصد بالمعلومات والمنشورات أن تكون، أو تشكل، أي نصيحة مالية أو استثمارية أو تجارية أو أنواع أخرى من النصائح أو التوصيات المقدمة أو المعتمدة من TradingView. اقرأ المزيد في شروط الاستخدام.