OPEN-SOURCE SCRIPT
تم تحديثه Purple Cloud
The above lines calculate several intermediate values used in the indicator's calculations. Here's a breakdown of each variable:
a1: Represents a modified Exponential Moving Average (EMA) of the high price series, subtracted by a Simple Moving Average (SMA) of the low price series.
a2: Takes the square root of the lowest value between the highest close price over the last 200 bars and the current close price, multiplied by a1.
b1: Represents a modified EMA of the low price series, subtracted by an SMA of the high price series.
b2: Takes the square root of the highest value between the lowest close price over the last 200 bars and the current close price, multiplied by b1.
c1: Represents the square root of a2 multiplied by b2.
These lines create multiple plots using the plot function. Each plot represents a displaced version of c1 by a certain multiple of the Average True Range (ATR) multiplied by a constant factor (0.1, 0.2, 0.3, etc.). The transparency (transp) is set to 100 for all plots.
ملاحظات الأخبار
Add Alpha ملاحظات الأخبار
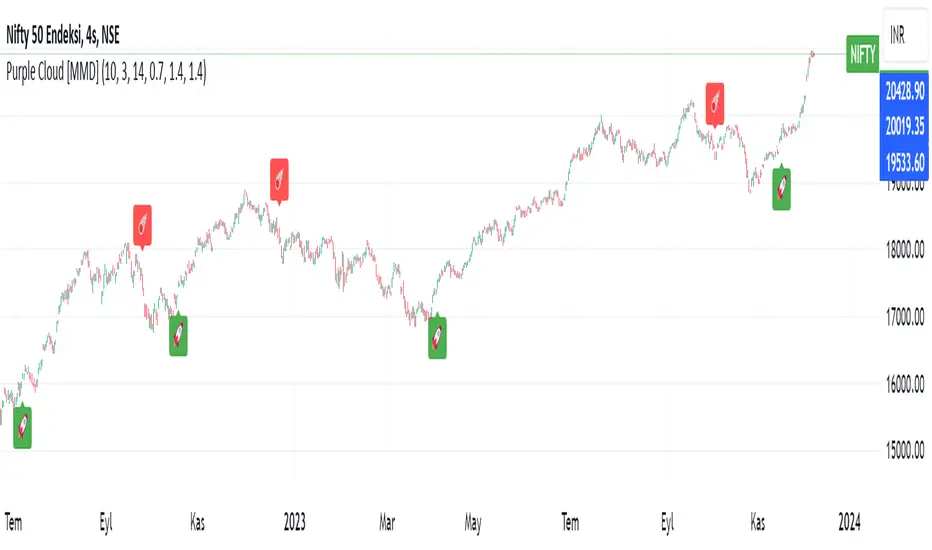
Added Pink Green Yellow bar.Green Bar--->Buy
Pink Bar--->Sell
Yellow Bar--->Unstable
ملاحظات الأخبار
I added Maybe Pump Maybe Dumpملاحظات الأخبار
Added Rsi Background Colorملاحظات الأخبار
Deleted Cloudsملاحظات الأخبار
Added Bomb Pump Dumpملاحظات الأخبار
Changed Allملاحظات الأخبار
Change Nameملاحظات الأخبار
added alert and funcsملاحظات الأخبار
Added colourملاحظات الأخبار
Added MMD Bandsملاحظات الأخبار
Added Supertrend and Ema 200 50 20ملاحظات الأخبار
Added Buying Pressure Threshold % and Selling Pressure Threshold % and changed formulaنص برمجي مفتوح المصدر
بروح TradingView الحقيقية، قام مبتكر هذا النص البرمجي بجعله مفتوح المصدر، بحيث يمكن للمتداولين مراجعة وظائفه والتحقق منها. شكرا للمؤلف! بينما يمكنك استخدامه مجانًا، تذكر أن إعادة نشر الكود يخضع لقواعد الموقع الخاصة بنا.
إخلاء المسؤولية
لا يُقصد بالمعلومات والمنشورات أن تكون، أو تشكل، أي نصيحة مالية أو استثمارية أو تجارية أو أنواع أخرى من النصائح أو التوصيات المقدمة أو المعتمدة من TradingView. اقرأ المزيد في شروط الاستخدام.
نص برمجي مفتوح المصدر
بروح TradingView الحقيقية، قام مبتكر هذا النص البرمجي بجعله مفتوح المصدر، بحيث يمكن للمتداولين مراجعة وظائفه والتحقق منها. شكرا للمؤلف! بينما يمكنك استخدامه مجانًا، تذكر أن إعادة نشر الكود يخضع لقواعد الموقع الخاصة بنا.
إخلاء المسؤولية
لا يُقصد بالمعلومات والمنشورات أن تكون، أو تشكل، أي نصيحة مالية أو استثمارية أو تجارية أو أنواع أخرى من النصائح أو التوصيات المقدمة أو المعتمدة من TradingView. اقرأ المزيد في شروط الاستخدام.