OPEN-SOURCE SCRIPT
تم تحديثه Normalized Quantitative Qualitative Estimation nQQE
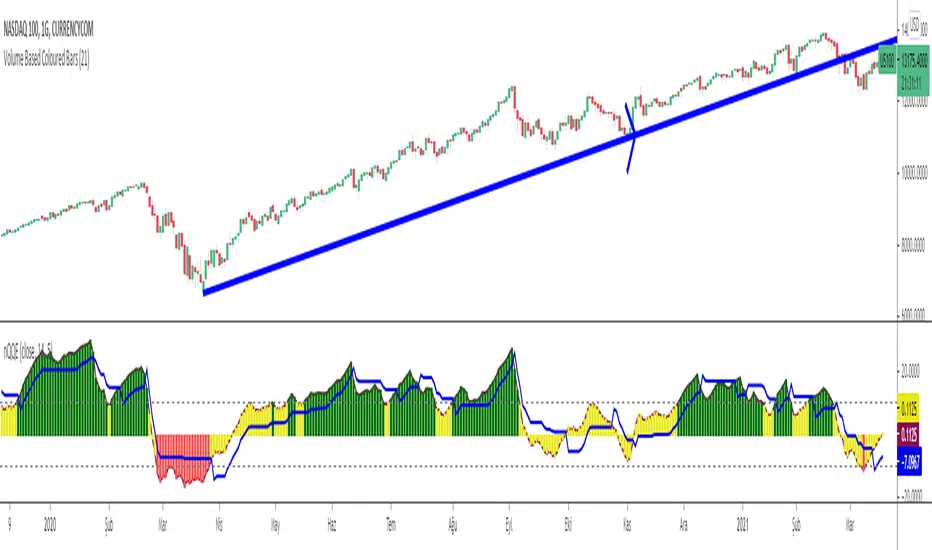
Normalized version of Quantitative Qualitative Estimation QQE:

Normalized QQE tries to overcome the problems of false signals due to RSI divergences on the original QQE indicator.

The main purpose is to determine and ride the trend as far as possible.
So users can identify:
UPTREND : when nQQE Histogram is GREEN (nQQE is above 10)
DOWNTREND : when nQQE Histogram is RED (nQQE is below -10)
SIDEWAYS: when nQQE Histogram is YELLOW (nQQE is between -10 and 10)
Calculation is very simple;
RSI based QQE oscillates between 0-100
nQQE is simply calculated as:
nQQE=QQE-50
to make the indicator fluctuate around 0 level to get more accurate signals.
Various alarms added.
Kıvanç Özbilgiç
Normalized QQE tries to overcome the problems of false signals due to RSI divergences on the original QQE indicator.
The main purpose is to determine and ride the trend as far as possible.
So users can identify:
UPTREND : when nQQE Histogram is GREEN (nQQE is above 10)
DOWNTREND : when nQQE Histogram is RED (nQQE is below -10)
SIDEWAYS: when nQQE Histogram is YELLOW (nQQE is between -10 and 10)
Calculation is very simple;
RSI based QQE oscillates between 0-100
nQQE is simply calculated as:
nQQE=QQE-50
to make the indicator fluctuate around 0 level to get more accurate signals.
Various alarms added.
Kıvanç Özbilgiç
ملاحظات الأخبار
deleted dummy partsنص برمجي مفتوح المصدر
بروح TradingView الحقيقية، قام مبتكر هذا النص البرمجي بجعله مفتوح المصدر، بحيث يمكن للمتداولين مراجعة وظائفه والتحقق منها. شكرا للمؤلف! بينما يمكنك استخدامه مجانًا، تذكر أن إعادة نشر الكود يخضع لقواعد الموقع الخاصة بنا.
Telegram t.me/AlgoRhytm
YouTube (Turkish): youtube.com/c/kivancozbilgic
YouTube (English): youtube.com/c/AlgoWorld
YouTube (Turkish): youtube.com/c/kivancozbilgic
YouTube (English): youtube.com/c/AlgoWorld
إخلاء المسؤولية
لا يُقصد بالمعلومات والمنشورات أن تكون، أو تشكل، أي نصيحة مالية أو استثمارية أو تجارية أو أنواع أخرى من النصائح أو التوصيات المقدمة أو المعتمدة من TradingView. اقرأ المزيد في شروط الاستخدام.
نص برمجي مفتوح المصدر
بروح TradingView الحقيقية، قام مبتكر هذا النص البرمجي بجعله مفتوح المصدر، بحيث يمكن للمتداولين مراجعة وظائفه والتحقق منها. شكرا للمؤلف! بينما يمكنك استخدامه مجانًا، تذكر أن إعادة نشر الكود يخضع لقواعد الموقع الخاصة بنا.
Telegram t.me/AlgoRhytm
YouTube (Turkish): youtube.com/c/kivancozbilgic
YouTube (English): youtube.com/c/AlgoWorld
YouTube (Turkish): youtube.com/c/kivancozbilgic
YouTube (English): youtube.com/c/AlgoWorld
إخلاء المسؤولية
لا يُقصد بالمعلومات والمنشورات أن تكون، أو تشكل، أي نصيحة مالية أو استثمارية أو تجارية أو أنواع أخرى من النصائح أو التوصيات المقدمة أو المعتمدة من TradingView. اقرأ المزيد في شروط الاستخدام.