PROTECTED SOURCE SCRIPT
TradingBot - Multi-RSI Histogram & Signal Smoother
Multi-RSI Histogram & Signal Smoother
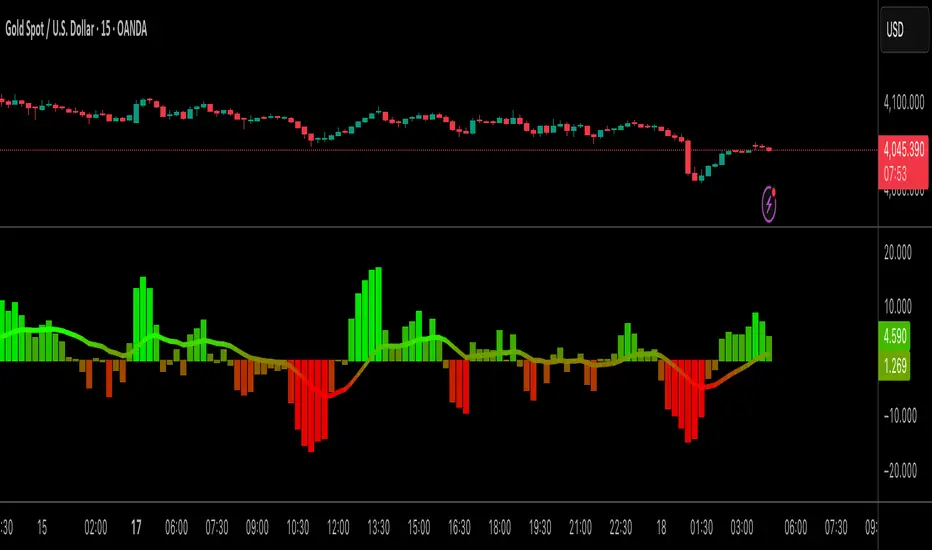
This indicator combines three RSI calculations and transforms their relative differences into a histogram, allowing users to observe shifts in momentum and market character in a structured, visual format. The goal of this tool is to present RSI-based relationships in a way that is easier to interpret compared to individual RSI lines, especially in environments where price moves between trending and ranging behaviour.
--------------------------------------------------------------------------------
How It Works (Objective Explanation)
--------------------------------------------------------------------------------
- The script calculates three RSI values using different lengths.
- It measures their relative differences (RSI3–RSI7, RSI7–RSI14, RSI3–RSI14).
- These three difference values are combined into a single histogram.
- A moving average (EMA) of the histogram is plotted to highlight short-term changes in the aggregated signal.
This approach allows users to view how multiple RSI speeds diverge or converge, which may help them evaluate momentum shifts. The histogram uses a gradient color scale purely for visual clarity.
--------------------------------------------------------------------------------
What the Indicator Shows (Non-Promotional)
--------------------------------------------------------------------------------
- Increasing histogram values simply mean the faster RSIs are rising relatively stronger than the slower RSIs.
- Decreasing histogram values indicate the opposite — fast RSIs weakening relative to slower ones.
- The EMA line smooths the raw histogram to make the changes easier to observe.
This indicator does not predict future price movement. It only reflects the real-time relationship between different RSI settings.
--------------------------------------------------------------------------------
Possible Use Cases (Allowed Under TradingView Rules)
--------------------------------------------------------------------------------
These are general technical-analysis use cases, not financial advice:
1. Identifying momentum compression or expansion
- When the histogram stays near zero, the different RSIs are close together.
- This may occur during consolidation phases.
2. Observing momentum transitions
- A shift from negative to positive values (or vice versa) shows a relative change in RSI behaviour.
- The EMA may help users track such transitions more smoothly.
3. Supporting existing strategies
- This indicator can be used as an additional layer of confirmation in systems that already rely on momentum or RSI-based tools.
- It should not be used as a standalone decision-making tool.
--------------------------------------------------------------------------------
Important Notes (Required for House-Rule Compliance)
--------------------------------------------------------------------------------
- This indicator does not generate buy or sell signals.
- It is not a guarantee of performance and should not be interpreted as financial advice.
- Past performance of any technical method does not ensure future outcomes.
- Users should test this script and adjust parameters based on their own preferences and trading approach.
نص برمجي محمي
تم نشر هذا النص البرمجي كمصدر مغلق. ومع ذلك، يمكنك استخدامه بحرية ودون أي قيود - تعرف على المزيد هنا.
إخلاء المسؤولية
لا يُقصد بالمعلومات والمنشورات أن تكون، أو تشكل، أي نصيحة مالية أو استثمارية أو تجارية أو أنواع أخرى من النصائح أو التوصيات المقدمة أو المعتمدة من TradingView. اقرأ المزيد في شروط الاستخدام.