TradeChartist Catalyst
===================================================================================================================
™TradeChartist Catalyst features
=============================
1. Catalyst Trade Bands
Catalyst Trade Bands comprises Equilibrium or Mean Bands, Inner Bands, Outer Bands and a Overall Mean Line. Catalyst Trade Bands help visualize the price action in relation to the Equilibrium Bands and clearly show how far away from the mean the current price is. The Trade Bands are of two types - Normal and Weighted. Weighted Bands are very sensitive to price action and a higher Bands length is recommended.
Simple 144 vs Weighted 144 Trade Bands
2. Equilibrium Touch Points
Every time the price touches the Equilibrium, an orange touch point appears on the chart. Normally, the Equilibrium line, for an optimal sample, acts as support or resistance. Price breaching or failing this line usually signals a Pull Back, a Throw Back or a Trend Change based on how the price interacts with it. This can be used with a secondary confirmation like RSI, Stochastic etc. For example, if the price falls back significantly only to touch the Equilibrium Line and fails to test the Overall Mean Line when Stochastic is below 30, this could mean a strong Pull Back rather than a Trend Change as shown in the example chart below.
When price fails the Equilibrium Bands, the fill colour of the Equilibrium bands changes to Bearish colour. If the Overall Mean line is below the Equilibrium bands and is in a reasonable distance, Mean will act as support as shown in the example below. Price failing the mean will test Inner Bands and strong bear momentum could take price to Outer Bands and beyond.
All the components of the Catalyst Trade Bands including the Touch Points can be enabled or disabled from the settings.
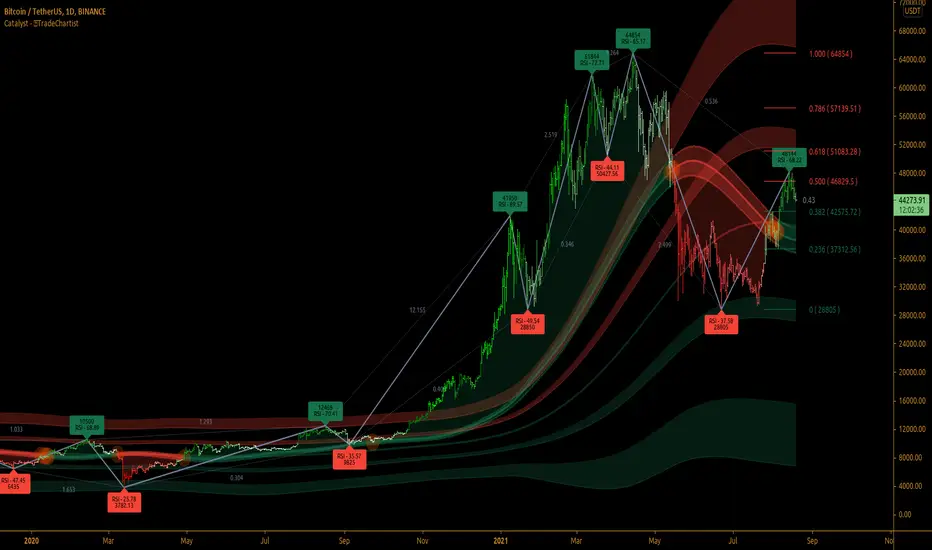
3. ZigZag & Fibonacci
Catalyst automatically plots ZigZag and Auto Fibonacci Retracement based on an intelligent logic and can be tweaked by changing the Zigzag & Auto-Fibs Factor from the settings. It also plots Fib ratios and connectors along with price highs and lows of ZigZag. The ratios can be especially useful to visually detect harmonic patterns and also serves as a useful feature for Fibonacci traders.
4. Fibonacci Customisation
Catalyst users can customise Fibonacci type and levels, including levels colour from Catalyst settings. In addition to Auto-Fibs, users can also plot Fibonacci levels based on Days or Candles lookback. This is a very useful feature if the user wants to override Auto-Fibs to suit his/her needs. Users can also reverse the Fibonacci Levels by enabling Reverse from settings.
In the following example chart of
===================================================================================================================
Best Practice: Test with different settings first using Paper Trades before trading with real money
===================================================================================================================
- Added option to show RSI at ZigZag Highs and Lows.
- Mean Touchpoint to show even when price doesn't touch Mean during Gap up/Gap down.
نص برمجي للمستخدمين المدعوين فقط
يمكن فقط للمستخدمين الذين تمت الموافقة عليهم من قبل المؤلف الوصول إلى هذا البرنامج النصي. ستحتاج إلى طلب الإذن والحصول عليه لاستخدامه. يتم منح هذا عادةً بعد الدفع. لمزيد من التفاصيل، اتبع تعليمات المؤلف أدناه أو اتصل ب TradeChartist مباشرة.
لا توصي TradingView بالدفع مقابل برنامج نصي أو استخدامه إلا إذا كنت تثق تمامًا في مؤلفه وتفهم كيفية عمله. يمكنك أيضًا العثور على بدائل مجانية ومفتوحة المصدر في نصوص مجتمعنا.
تعليمات المؤلف
Telegram - @Trade_Chartist
Free Scripts - bit.ly/Free-Scripts
إخلاء المسؤولية
نص برمجي للمستخدمين المدعوين فقط
يمكن فقط للمستخدمين الذين تمت الموافقة عليهم من قبل المؤلف الوصول إلى هذا البرنامج النصي. ستحتاج إلى طلب الإذن والحصول عليه لاستخدامه. يتم منح هذا عادةً بعد الدفع. لمزيد من التفاصيل، اتبع تعليمات المؤلف أدناه أو اتصل ب TradeChartist مباشرة.
لا توصي TradingView بالدفع مقابل برنامج نصي أو استخدامه إلا إذا كنت تثق تمامًا في مؤلفه وتفهم كيفية عمله. يمكنك أيضًا العثور على بدائل مجانية ومفتوحة المصدر في نصوص مجتمعنا.
تعليمات المؤلف
Telegram - @Trade_Chartist
Free Scripts - bit.ly/Free-Scripts