OPEN-SOURCE SCRIPT
تم تحديثه Market Structure (Nephew_Sam_)
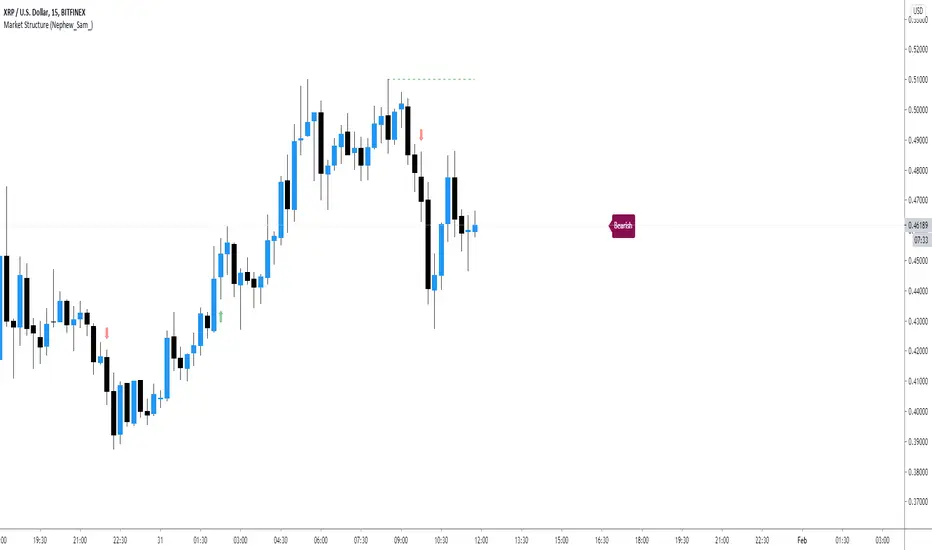
This indicator consists of 3 features:
1. Plots label to the right for current market structure
2. Plots dashed line to show where the next market structure would be
3. Draws arrows above/below historical market structure breaks
This might get a little to noisy in ranging markets or lower timeframes but it does the job.
Credits to SimpleCryptoLife for the source code.
This script is take from the indicator "True Market Structure" which is created by the above mentioned user
Copyright rules for reusing the script:
// == COPYRIGHT ==
// Script by @SimpleCrpytoLife. This script is open-source.
// --> If you use ideas from it, you don't need to ask or give credit to me.
// --> If you copy code out of here to adapt for your own script, it must be open-source. You don't need to ask permission, just credit @SimpleCryptoLife.
ملاحظات الأخبار
Added multiple timeframes labelملاحظات الأخبار
Reverted new update, too many bugs.نص برمجي مفتوح المصدر
بروح TradingView الحقيقية، قام مبتكر هذا النص البرمجي بجعله مفتوح المصدر، بحيث يمكن للمتداولين مراجعة وظائفه والتحقق منها. شكرا للمؤلف! بينما يمكنك استخدامه مجانًا، تذكر أن إعادة نشر الكود يخضع لقواعد الموقع الخاصة بنا.
إخلاء المسؤولية
لا يُقصد بالمعلومات والمنشورات أن تكون، أو تشكل، أي نصيحة مالية أو استثمارية أو تجارية أو أنواع أخرى من النصائح أو التوصيات المقدمة أو المعتمدة من TradingView. اقرأ المزيد في شروط الاستخدام.
نص برمجي مفتوح المصدر
بروح TradingView الحقيقية، قام مبتكر هذا النص البرمجي بجعله مفتوح المصدر، بحيث يمكن للمتداولين مراجعة وظائفه والتحقق منها. شكرا للمؤلف! بينما يمكنك استخدامه مجانًا، تذكر أن إعادة نشر الكود يخضع لقواعد الموقع الخاصة بنا.
إخلاء المسؤولية
لا يُقصد بالمعلومات والمنشورات أن تكون، أو تشكل، أي نصيحة مالية أو استثمارية أو تجارية أو أنواع أخرى من النصائح أو التوصيات المقدمة أو المعتمدة من TradingView. اقرأ المزيد في شروط الاستخدام.