INVITE-ONLY SCRIPT
Skynet PA osc
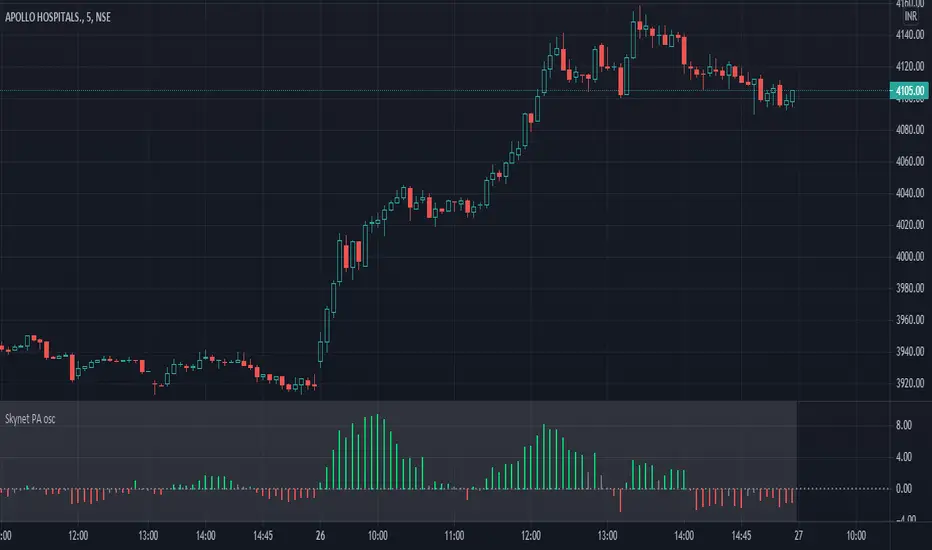
The Skynet PA osc has the following features :
1>>> Oscillator : The oscillator represents the rate of change of close price for the past 20 candles.
1.a> Bullish signal : When the oscillator turns green/lime color, it indicates that the price is gaining momentum on the upside.
1.b> Bearish signal : When the oscillator turns red, it indicates that the price is gaining momentum on the downside.
2>>> Entry/exit points :
2.a>Strong bullish: When an aqua/blue color diamond appears, it indicates a strong bullish momentum for the price.
2.b>Strong bearish : When a pink/purple color diamond appears on the zero line, it indicates a strong bearish momentum for the price.
**** Volume along with the oscillator is used to generate the diamond labels.
Disclaimer: This indicator is not 100% accurate and false signals are generated from time to time. Trading in the markets involves huge risks and one should always do his/her own research before making any trading decisions. This indicator is only designed to help you make a trading decision.
نص برمجي للمستخدمين المدعوين فقط
الوصول إلى هذا النص مقيد للمستخدمين المصرح لهم من قبل المؤلف وعادة ما يكون الدفع مطلوباً. يمكنك إضافته إلى مفضلاتك، لكن لن تتمكن من استخدامه إلا بعد طلب الإذن والحصول عليه من مؤلفه. تواصل مع skynet970 للحصول على مزيد من المعلومات، أو اتبع إرشادات المؤلف أدناه.
لا تقترح TradingView الدفع مقابل النصوص البرمجية واستخدامها حتى تثق بنسبة 100٪ في مؤلفها وتفهم كيفية عملها. في كثير من الحالات، يمكنك العثور على بديل جيد مفتوح المصدر مجانًا في نصوص مجتمع الخاصة بنا .
تعليمات المؤلف
″You can get this indicator by leaving me a private message on tradingview.
هل تريد استخدام هذا النص البرمجي على الرسم البياني؟
تحذير: يرجى القراءة قبل طلب الوصول.
إخلاء المسؤولية
لا يُقصد بالمعلومات والمنشورات أن تكون، أو تشكل، أي نصيحة مالية أو استثمارية أو تجارية أو أنواع أخرى من النصائح أو التوصيات المقدمة أو المعتمدة من TradingView. اقرأ المزيد في شروط الاستخدام.