OPEN-SOURCE SCRIPT
Lowry Upside % Volume
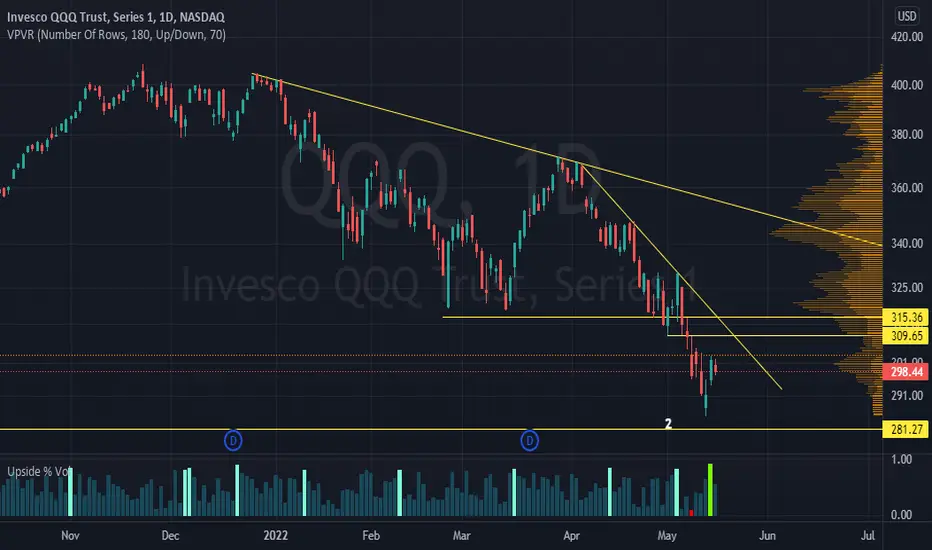
This script takes the total NYSE volume for the day and determines what percentage of that volume is Upside Volume (or buying volume).
What's different in this script compared to others is that the 3 most essential values determined by Paul F. Desmond's Dow Award-winning paper for Lowry's Reports are color coded:
1) 90% Upside Volume Day
2) 80% Upside Volume Day
3) 90% Downside Volume Day
According to Paul's award-winning research, these precise criteria are objective definitions of panic selling and panic buying and are generally near major market tops and bottoms.
His Dow Award-winning paper on the topic can be explored and scrutinized in more detail here:
docs.cmtassociation.org/docs/2002DowAwardb.pdf
نص برمجي مفتوح المصدر
بروح TradingView الحقيقية، قام مبتكر هذا النص البرمجي بجعله مفتوح المصدر، بحيث يمكن للمتداولين مراجعة وظائفه والتحقق منها. شكرا للمؤلف! بينما يمكنك استخدامه مجانًا، تذكر أن إعادة نشر الكود يخضع لقواعد الموقع الخاصة بنا.
إخلاء المسؤولية
لا يُقصد بالمعلومات والمنشورات أن تكون، أو تشكل، أي نصيحة مالية أو استثمارية أو تجارية أو أنواع أخرى من النصائح أو التوصيات المقدمة أو المعتمدة من TradingView. اقرأ المزيد في شروط الاستخدام.