OPEN-SOURCE SCRIPT
تم تحديثه Seasonality Table - Tabular Form
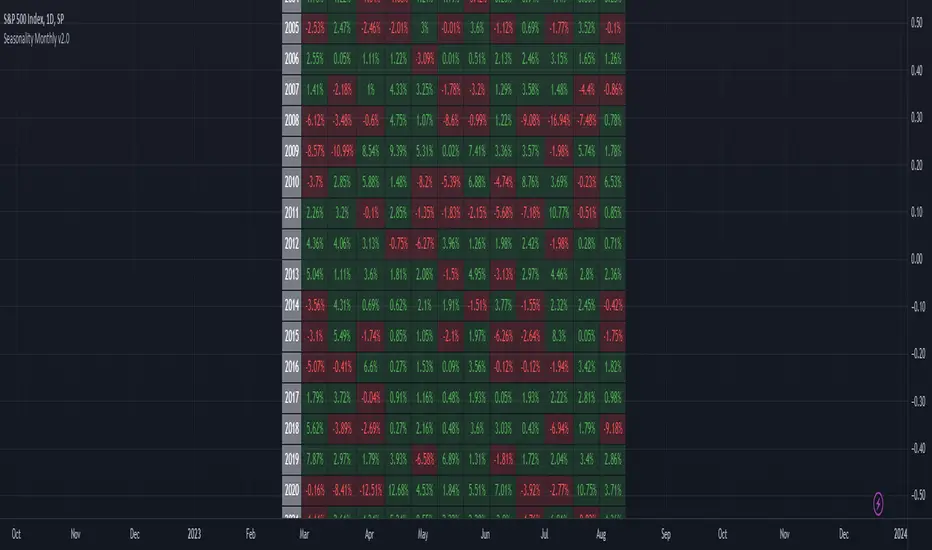
This indicator displays the seasonality data for any instrument (index/stock/futures/currency) in a tabular data.
User can change the start of the year for analysis from the inputs.
Year is represented in rows and Month is represented in cols.
This indicator uses Monthly Data feed to calculate the % change
Summary data for the month is displayed as the last row
User can change the start of the year for analysis from the inputs.
Year is represented in rows and Month is represented in cols.
This indicator uses Monthly Data feed to calculate the % change
Summary data for the month is displayed as the last row
ملاحظات الأخبار
Updated chartملاحظات الأخبار
Switched to Daily feed from Monthly as Monthly feed is not reliable for US futures dataملاحظات الأخبار
Added versioningملاحظات الأخبار
- Added a new row at the bottom to show positive / total count
ملاحظات الأخبار
Fixed US Futures Sunday Open issueملاحظات الأخبار
Switched calculation to Monthly close levels instead of accumulating % Daily Gains.نص برمجي مفتوح المصدر
بروح TradingView الحقيقية، قام مبتكر هذا النص البرمجي بجعله مفتوح المصدر، بحيث يمكن للمتداولين مراجعة وظائفه والتحقق منها. شكرا للمؤلف! بينما يمكنك استخدامه مجانًا، تذكر أن إعادة نشر الكود يخضع لقواعد الموقع الخاصة بنا.
إخلاء المسؤولية
لا يُقصد بالمعلومات والمنشورات أن تكون، أو تشكل، أي نصيحة مالية أو استثمارية أو تجارية أو أنواع أخرى من النصائح أو التوصيات المقدمة أو المعتمدة من TradingView. اقرأ المزيد في شروط الاستخدام.
نص برمجي مفتوح المصدر
بروح TradingView الحقيقية، قام مبتكر هذا النص البرمجي بجعله مفتوح المصدر، بحيث يمكن للمتداولين مراجعة وظائفه والتحقق منها. شكرا للمؤلف! بينما يمكنك استخدامه مجانًا، تذكر أن إعادة نشر الكود يخضع لقواعد الموقع الخاصة بنا.
إخلاء المسؤولية
لا يُقصد بالمعلومات والمنشورات أن تكون، أو تشكل، أي نصيحة مالية أو استثمارية أو تجارية أو أنواع أخرى من النصائح أو التوصيات المقدمة أو المعتمدة من TradingView. اقرأ المزيد في شروط الاستخدام.