OPEN-SOURCE SCRIPT
J Weighted Average Price
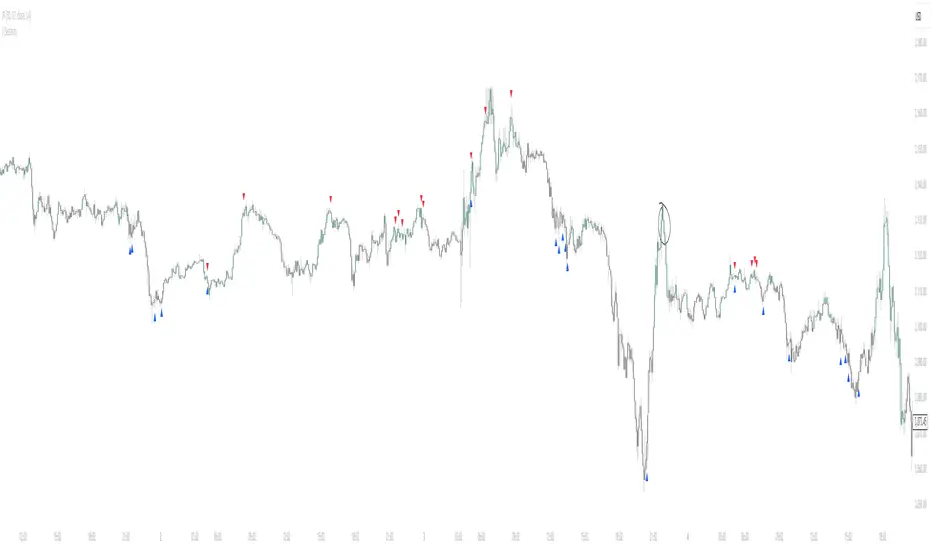
📘 How to Use the OBV VWAP Reentry Signal Effectively
This indicator plots a VWAP based on OBV (On-Balance Volume), along with dynamic bands to identify overbought and oversold conditions in volume flow.
🔺 Red Triangle Up: Appears when OBV crosses back below the upper band → Potential reversal from overbought → Watch for short opportunities.
🔻 Blue Triangle Down: Appears when OBV crosses back above the lower band → Potential reversal from oversold → Watch for long opportunities.
📌 Tip: Use these signals in confluence with price action or trend confirmation to filter false signals. For example:
Enter short after a reentry from upper band and a lower high in price.
Enter long after a reentry from lower band and a bullish candle structure.
This setup helps you catch mean reversion moves based on volume flow, not just price.
نص برمجي مفتوح المصدر
بروح TradingView الحقيقية، قام مبتكر هذا النص البرمجي بجعله مفتوح المصدر، بحيث يمكن للمتداولين مراجعة وظائفه والتحقق منها. شكرا للمؤلف! بينما يمكنك استخدامه مجانًا، تذكر أن إعادة نشر الكود يخضع لقواعد الموقع الخاصة بنا.
إخلاء المسؤولية
لا يُقصد بالمعلومات والمنشورات أن تكون، أو تشكل، أي نصيحة مالية أو استثمارية أو تجارية أو أنواع أخرى من النصائح أو التوصيات المقدمة أو المعتمدة من TradingView. اقرأ المزيد في شروط الاستخدام.