OPEN-SOURCE SCRIPT
AT Ratio
AT Ratio
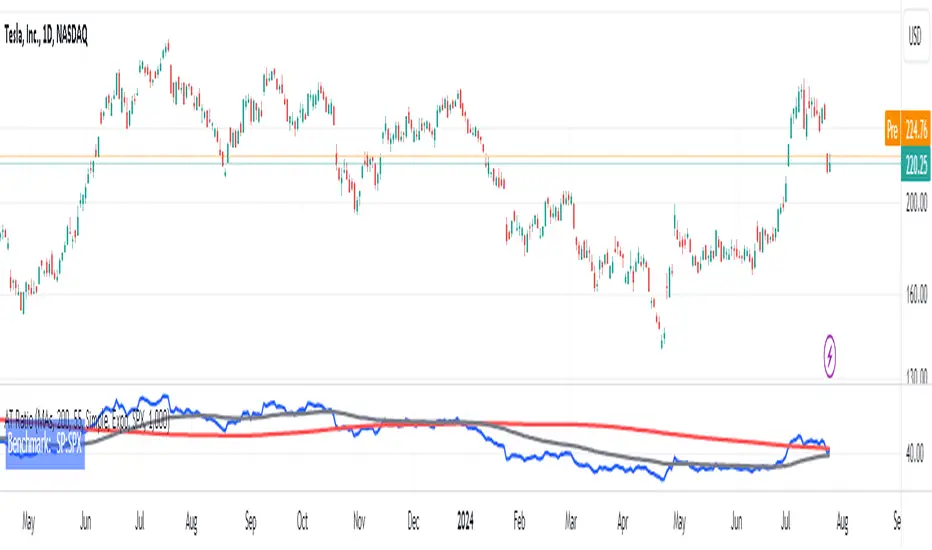
This indicator plots a ratio chart of 2 symbols, calculated as symbol1/symbol2.
The current chart symbol is used as symbol1.
A ratio chart allows to determine the relative strength of an asset compared to another asset.
It can be used for example to compare two stocks or a stock to its benchmark index, thus showing,
- if a stock has strength on its own (climbing ratio chart)
- if a stock just moves with the index (sideways ratio chart)
- if a stock is weaker than the index (falling ratio chart)
Inputs:
Style:
Plain: Only the ratio chart is plotted
MAs: Additional Moving Averages of the ratio chart are plotted
Perdiod Long: The period for the long MA
Perdiod Short: The period for the long MA
MA Type Long:
Simple: A simple MA is used
Expo: An exponential MA is used
MA Type Short:
Simple: A simple MA is used
Expo: An exponential MA is used
Ratio Symbol: The symbol to be used for symbol2
Factor: A factor the ratio value is multiplied by
Open-source script
نص برمجي مفتوح المصدر
بروح TradingView الحقيقية، قام مبتكر هذا النص البرمجي بجعله مفتوح المصدر، بحيث يمكن للمتداولين مراجعة وظائفه والتحقق منها. شكرا للمؤلف! بينما يمكنك استخدامه مجانًا، تذكر أن إعادة نشر الكود يخضع لقواعد الموقع الخاصة بنا.
إخلاء المسؤولية
لا يُقصد بالمعلومات والمنشورات أن تكون، أو تشكل، أي نصيحة مالية أو استثمارية أو تجارية أو أنواع أخرى من النصائح أو التوصيات المقدمة أو المعتمدة من TradingView. اقرأ المزيد في شروط الاستخدام.