OPEN-SOURCE SCRIPT
Volatility Based Momentum Oscillator (VBMO)
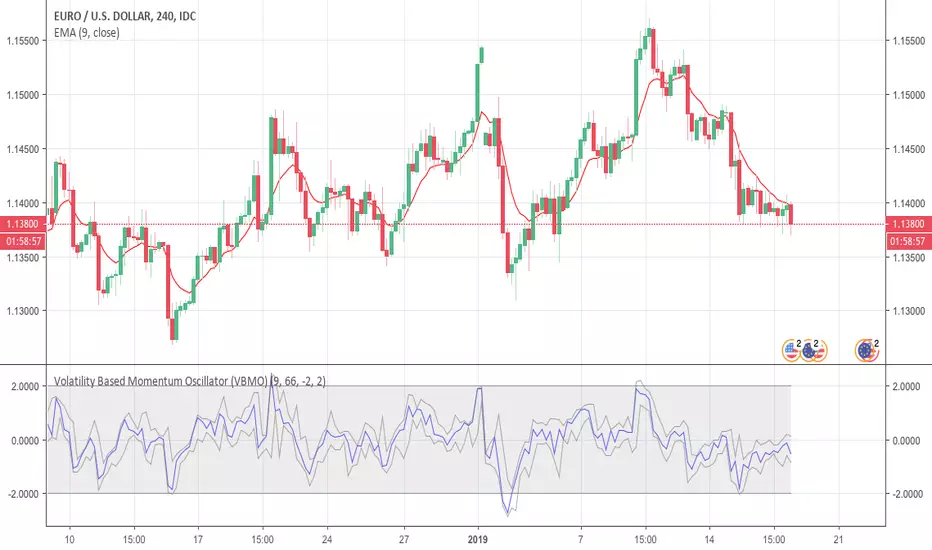
There is a frequent and definitive pattern in price movement, whereby price will steadily drift lower, then accelerate before bottoming out. Similarly, price will often steadily rise, then accelerate into a climax top.
The Volatility Based Momentum Oscillator (VBMO) is designed to delineate between steady versus more accelerated and climactic price movements.
VBMO is calculated using a short-term moving average, the distance of price from this moving average, and the trading instrument’s historical volatility. Even though VBMO’s calculation is relatively simple, the resulting values can help traders identify, analyze and act upon many scenarios, such as climax tops, reversals, and capitulation. Moreover, since the units and scale for VBMO are always the same, the indicator can be used in a consistent manner across multiple timeframes and instruments.
For more details, there is an article further describing VBMO and its applicability.
نص برمجي مفتوح المصدر
بروح TradingView الحقيقية، قام مبتكر هذا النص البرمجي بجعله مفتوح المصدر، بحيث يمكن للمتداولين مراجعة وظائفه والتحقق منها. شكرا للمؤلف! بينما يمكنك استخدامه مجانًا، تذكر أن إعادة نشر الكود يخضع لقواعد الموقع الخاصة بنا.
إخلاء المسؤولية
لا يُقصد بالمعلومات والمنشورات أن تكون، أو تشكل، أي نصيحة مالية أو استثمارية أو تجارية أو أنواع أخرى من النصائح أو التوصيات المقدمة أو المعتمدة من TradingView. اقرأ المزيد في شروط الاستخدام.