OPEN-SOURCE SCRIPT
Mikes 5 min HHLL Spotter
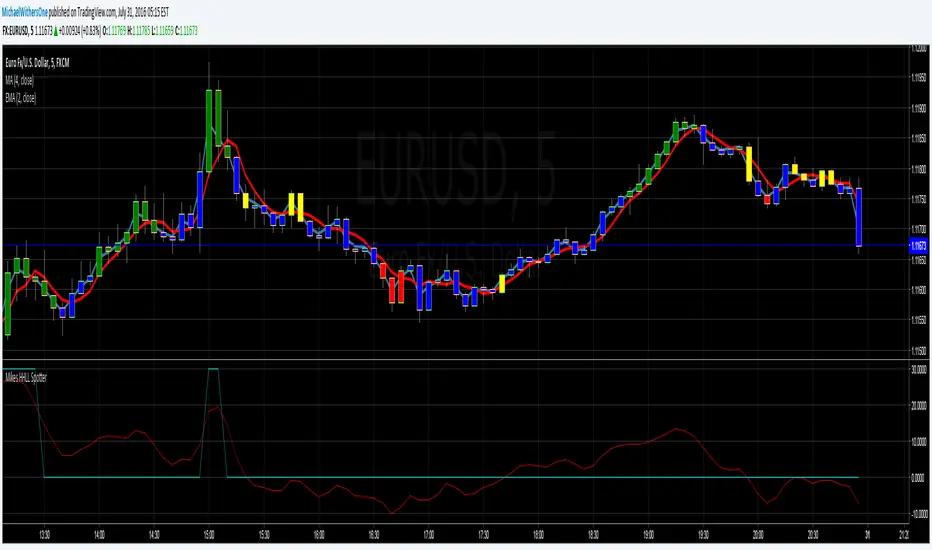
Attempts to find higher highs and lower lows in the 5 minute window. When the light blue graph line peaks , you should investigate selling , when the light blue graph line dips you should investigate buying.
This is good for identifying oversold and over bought positions
This is good for identifying oversold and over bought positions
نص برمجي مفتوح المصدر
بروح TradingView الحقيقية، قام مبتكر هذا النص البرمجي بجعله مفتوح المصدر، بحيث يمكن للمتداولين مراجعة وظائفه والتحقق منها. شكرا للمؤلف! بينما يمكنك استخدامه مجانًا، تذكر أن إعادة نشر الكود يخضع لقواعد الموقع الخاصة بنا.
إخلاء المسؤولية
لا يُقصد بالمعلومات والمنشورات أن تكون، أو تشكل، أي نصيحة مالية أو استثمارية أو تجارية أو أنواع أخرى من النصائح أو التوصيات المقدمة أو المعتمدة من TradingView. اقرأ المزيد في شروط الاستخدام.