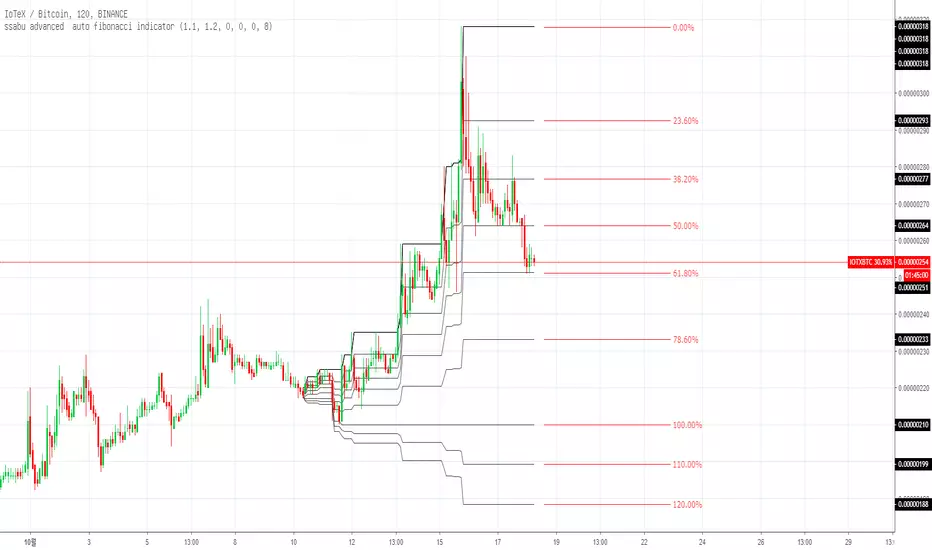
ssabu advanced auto fibonacci indicator

It is an index that automatically draws the Fibonacci ratio.
You can see the Fibonacci ratio you want to see by checking the rising trend and the falling trend in the setting, and you can set the peak time for the peak measurement to the input value.
The upward trend is automatically drawn with black lines like the above snapshot, and the downward trend is drawn with a blue line.
The red Fibonacci rate is drawn directly on the indicator.
➕ In addition to the advanced auto fibonacci indicator, we have added five additional lines at the rate you want to include.
➕ You can set alerts for both the existing Fibonacci ratio and the percentage you want to include.
☑️ The 110% and 120% in the main screenshot is a randomly created line for explaining that feature.
☑️ For the sake of clarity, we have created a line with 110% and 120%, but actually we need to make it between 0% and 100%
────────────────────────────────────────────────────────────────────────────────────────────────────────────
자동으로 피보나치 비율을 그려주는 지표 입니다.
설정에서 상승추세와 하락추세를 체크하여 보고 싶은 추세의 피보나치 비율을 볼 수 있고 고점저점 측정 시간을 인풋값으로 설정해 줄 수 있습니다.
상승추세는 위의 스샷과 같이 검은선으로 자동으로 그려주고 하락추세는 파란선으로 그려줍니다.
빨간색의 피보나치 비율은 지표로 직접 그린것 입니다.
➕ advanced auto fibonacci indicator에는 추가적으로 사용자가 넣고 싶은 비율의 선을 5개 추가하였습니다.
➕ 기존의 피보나치 비율과 사용자가 넣고 싶은 비율에 모두 알림설정이 가능합니다.
☑️ 메인 스크린샷에 있는 110%, 120%는 해당 기능의 설명을 위해 임의로 만든 선입니다.
☑️ 설명을 위해서 110%와 120%로 선을 만들었지만 실제로는 0% ~ 100% 사이의 값으로 만들어야 합니다.
────────────────────────────────────────────────────────────────────────────────────────────────────────────
상승추세
하락추세
نص برمجي للمستخدمين المدعوين فقط
يمكن فقط للمستخدمين الذين تمت الموافقة عليهم من قبل المؤلف الوصول إلى هذا البرنامج النصي. ستحتاج إلى طلب الإذن والحصول عليه لاستخدامه. يتم منح هذا عادةً بعد الدفع. لمزيد من التفاصيل، اتبع تعليمات المؤلف أدناه أو اتصل ب ssabu مباشرة.
لا توصي TradingView بالدفع مقابل برنامج نصي أو استخدامه إلا إذا كنت تثق تمامًا في مؤلفه وتفهم كيفية عمله. يمكنك أيضًا العثور على بدائل مجانية ومفتوحة المصدر في نصوص مجتمعنا.
تعليمات المؤلف
cafe.naver.com/tradingviewmania
【 트레이딩 시스템 】
tradingviewmania-menu.oopy.io/
【 카톡 】
bit.ly/싸부_문의1
【 텔레그램 】
bit.ly/싸부텔레
إخلاء المسؤولية
نص برمجي للمستخدمين المدعوين فقط
يمكن فقط للمستخدمين الذين تمت الموافقة عليهم من قبل المؤلف الوصول إلى هذا البرنامج النصي. ستحتاج إلى طلب الإذن والحصول عليه لاستخدامه. يتم منح هذا عادةً بعد الدفع. لمزيد من التفاصيل، اتبع تعليمات المؤلف أدناه أو اتصل ب ssabu مباشرة.
لا توصي TradingView بالدفع مقابل برنامج نصي أو استخدامه إلا إذا كنت تثق تمامًا في مؤلفه وتفهم كيفية عمله. يمكنك أيضًا العثور على بدائل مجانية ومفتوحة المصدر في نصوص مجتمعنا.
تعليمات المؤلف
cafe.naver.com/tradingviewmania
【 트레이딩 시스템 】
tradingviewmania-menu.oopy.io/
【 카톡 】
bit.ly/싸부_문의1
【 텔레그램 】
bit.ly/싸부텔레