PSP Table [Pogiest]
Precision Swing Point (PSP) is a concept derived from Quarterly Theory concepts originating from ICT methodologies. The concept typically uses a 3-candle swing formation in which candle 2 has a divergence in the closing price with one asset compared to the other two assets in a correlated asset triad (i.e. one closes bullish and two closes bearish, vice-versa). The indicator is designed to track PSPs in real time as they are forming.
Note: Credit of concepts/ideas goes to TraderDaye.
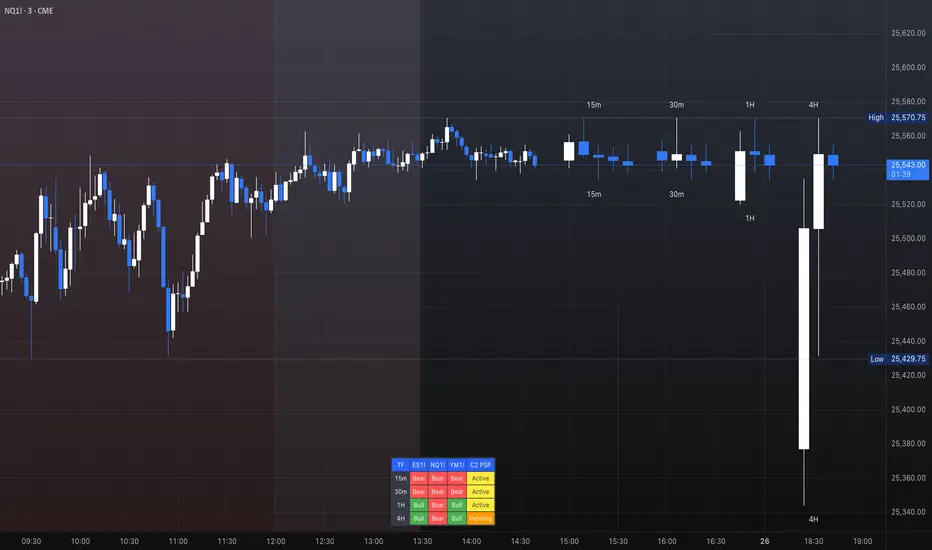
In the image above, the higher timeframe candle overlay is displayed on the chart to be shown as an example with the indicator (table). Higher timeframe candles are not included as part of the indicator. This indicator is only comprised of the table shown.
Timeframe Column:
1. Displays up to four different timeframes to monitor.
Asset Columns:
1. Cells display “Bull” or “Bear” showing the current state of each candle and updates in real-time tick by tick.
C2 PSP Column:
1. “Inactive” indicates no divergence in all assets (i.e. all three assets in a triad are all printing bullish or bearish candles)
2. “Pending” indicates a potential divergence in candle 2’s closing price (i.e. one asset’s current state in candle 2 is bearish while the others are bullish, vice versa). This updates in real-time tick by tick and continues to monitor each candle as they form for a candle 2 divergence.
3. “Active” indicates a confirmed candle 2 divergence.
Note: Any historical PSPs will not be displayed in the table as this indicator only tracks PSPs in real time and continuously monitors for potential PSPs and confirmed PSPs.
Settings
1. Choose up to three different assets to monitor.
Note: If only two are selected, the indicator will only display the two selected and compare the two assets for divergences. If one is selected, a warning sign will be displayed to select at least two assets.
2. Choose up to four different timeframes. Option to deselect timeframes.
3. Toggle option to show/hide the table.
4. Adjust the table positioning to be displayed on the chart.
6. Option to change text size in the table cells. This will also increase/decrease the size of the table.
7. Table Color Customization gives you options to change the background colors of the cells including text color.
What makes this indicator unique:
1. Track current PSP status in real-time tick by tick as candles form in multiple timeframes.
2. Instead of switching through timeframes to check for PSPs, they are consolidated in one table.
Risk Disclaimer
This indicator is for educational and informational purposes only and does not constitute financial advice. All trading and investment decisions remain solely the responsibility of the user.
Trading involves a high degree of risk, and past performance is not indicative of future results.
Always conduct your own research and consult with a qualified financial professional before making any trading decisions.
By using this indicator, users acknowledge they understand these risks and accept full responsibility for their trading decisions and outcomes.
نص برمجي للمستخدمين المدعوين فقط
يمكن فقط للمستخدمين الذين تمت الموافقة عليهم من قبل المؤلف الوصول إلى هذا البرنامج النصي. ستحتاج إلى طلب الإذن والحصول عليه لاستخدامه. يتم منح هذا عادةً بعد الدفع. لمزيد من التفاصيل، اتبع تعليمات المؤلف أدناه أو اتصل Pogiest مباشرة.
لا توصي TradingView بالدفع مقابل برنامج نصي أو استخدامه إلا إذا كنت تثق تمامًا في مؤلفه وتفهم كيفية عمله. يمكنك أيضًا العثور على بدائل مجانية ومفتوحة المصدر في نصوص مجتمعنا.
تعليمات المؤلف
إخلاء المسؤولية
نص برمجي للمستخدمين المدعوين فقط
يمكن فقط للمستخدمين الذين تمت الموافقة عليهم من قبل المؤلف الوصول إلى هذا البرنامج النصي. ستحتاج إلى طلب الإذن والحصول عليه لاستخدامه. يتم منح هذا عادةً بعد الدفع. لمزيد من التفاصيل، اتبع تعليمات المؤلف أدناه أو اتصل Pogiest مباشرة.
لا توصي TradingView بالدفع مقابل برنامج نصي أو استخدامه إلا إذا كنت تثق تمامًا في مؤلفه وتفهم كيفية عمله. يمكنك أيضًا العثور على بدائل مجانية ومفتوحة المصدر في نصوص مجتمعنا.