OPEN-SOURCE SCRIPT
Relative Strength Index with Highlights and Success Test
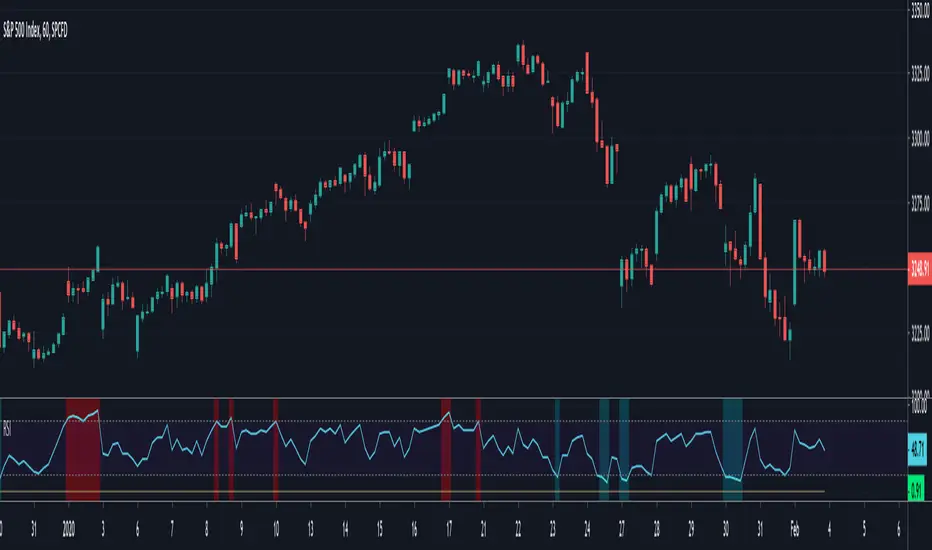
This script does two things:
1- Highlights extreme levels on RSI
2- Calculates what % of the time, price closed higher (lower) with some minimum threshold when RSI was below oversold (overbought) level in a predefined number of bars.
I use this to understand if buying the dip/selling the rip works for a security and on what time frame and if it could be a profitable strategy that can generate large enough moves.
No guarantees on the accuracy of the code. Let me know if you see anything wrong
نص برمجي مفتوح المصدر
بروح TradingView الحقيقية، قام مبتكر هذا النص البرمجي بجعله مفتوح المصدر، بحيث يمكن للمتداولين مراجعة وظائفه والتحقق منها. شكرا للمؤلف! بينما يمكنك استخدامه مجانًا، تذكر أن إعادة نشر الكود يخضع لقواعد الموقع الخاصة بنا.
إخلاء المسؤولية
لا يُقصد بالمعلومات والمنشورات أن تكون، أو تشكل، أي نصيحة مالية أو استثمارية أو تجارية أو أنواع أخرى من النصائح أو التوصيات المقدمة أو المعتمدة من TradingView. اقرأ المزيد في شروط الاستخدام.