OPEN-SOURCE SCRIPT
تم تحديثه Auto-Support
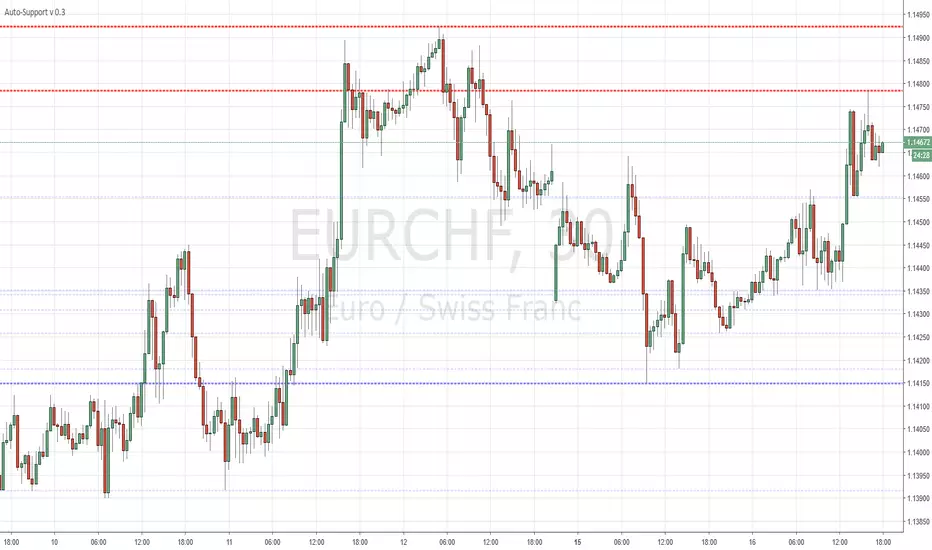
Fairly simple script that automatically draws highs and lows for the past X periods at various intervals.
3 Settings :
"Sensitivity" which amounts to the horizontal separation from one high to the next high (default multiplicator : 10)
Variable "b" which is the HEX color for resistances (default : red)
Variable "c" which is the HEX color for supports (default : blue)
More HEX color codes on hexcolortool.com/ (not my webpage :)
Feel free to edit the script to your taste.
ملاحظات الأخبار
*** Bug Fix version after today's error message issues ****Anyone using previous versions is strongly advised to update
> Removed some higher s/r levels from the code
> Sensitivity can now only be set between 1 - 10, higher numbers cause the script to fail to load
***********************************************************************
Fairly simple script that automatically draws highs and lows for the past X periods at various intervals.
3 Settings :
"Sensitivity" which amounts to the horizontal separation from one high to the next high (default multiplicator : 10)
"Transparency" ... Multiple lines piling up at the same level will cause the s/r levels to be more or less visible.
Variable "b" which is the HEX color for resistances (default : red)
Variable "c" which is the HEX color for supports (default : blue)
More HEX color codes on hexcolortool.com/ (not my webpage :)
Feel free to edit the script to your taste.
نص برمجي مفتوح المصدر
بروح TradingView الحقيقية، قام مبتكر هذا النص البرمجي بجعله مفتوح المصدر، بحيث يمكن للمتداولين مراجعة وظائفه والتحقق منها. شكرا للمؤلف! بينما يمكنك استخدامه مجانًا، تذكر أن إعادة نشر الكود يخضع لقواعد الموقع الخاصة بنا.
إخلاء المسؤولية
لا يُقصد بالمعلومات والمنشورات أن تكون، أو تشكل، أي نصيحة مالية أو استثمارية أو تجارية أو أنواع أخرى من النصائح أو التوصيات المقدمة أو المعتمدة من TradingView. اقرأ المزيد في شروط الاستخدام.