OPEN-SOURCE SCRIPT
تم تحديثه KJS-- Gost Pivot MA
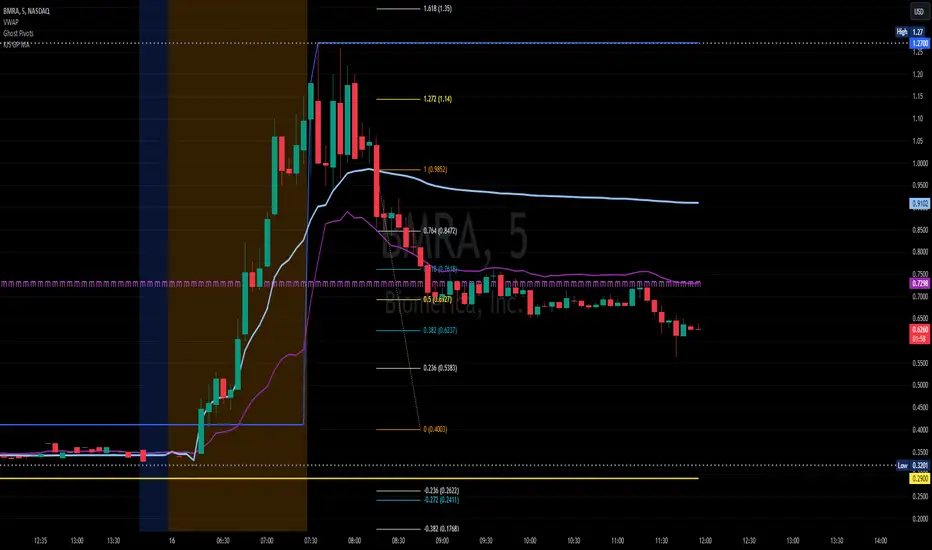
KJS Ghost Pivot Moving Average
This indicator calculates a "Ghost Pivot" by estimating where the monthly pivot level would be if the current candle's close represented the end of the month. The calculation uses:
• The current month's high and low from regular trading hours (RTH).
• The current candle's close, which includes both premarket and after-hours data.
It also smooths the ghost pivot using a customizable simple moving average (SMA).
Features:
• Plots the current month's high (blue) and low (yellow) based on RTH data.
• Calculates and plots a dynamic pivot (purple line) as the average of the monthly high, low, and current close (HLC3).
• Includes a customizable SMA length for smoother pivot tracking (default: 3).
This indicator helps traders anticipate potential monthly pivot levels in real-time while visualizing key support and resistance areas.
ملاحظات الأخبار
KJS Ghost Pivot Moving AverageThis indicator calculates a “Ghost Pivot" by estimating where the monthly pivot level would be if the current candle’s close represented the end of the month. The calculation uses:
It also smooths the ghost pivot using a customizable simple moving average (SMA).
Features:
This indicator helps traders anticipate potential monthly pivot levels in real-time while visualizing key support and resistance areas.
ملاحظات الأخبار
Update to Pine Script v6نص برمجي مفتوح المصدر
بروح TradingView الحقيقية، قام مبتكر هذا النص البرمجي بجعله مفتوح المصدر، بحيث يمكن للمتداولين مراجعة وظائفه والتحقق منها. شكرا للمؤلف! بينما يمكنك استخدامه مجانًا، تذكر أن إعادة نشر الكود يخضع لقواعد الموقع الخاصة بنا.
إخلاء المسؤولية
لا يُقصد بالمعلومات والمنشورات أن تكون، أو تشكل، أي نصيحة مالية أو استثمارية أو تجارية أو أنواع أخرى من النصائح أو التوصيات المقدمة أو المعتمدة من TradingView. اقرأ المزيد في شروط الاستخدام.
نص برمجي مفتوح المصدر
بروح TradingView الحقيقية، قام مبتكر هذا النص البرمجي بجعله مفتوح المصدر، بحيث يمكن للمتداولين مراجعة وظائفه والتحقق منها. شكرا للمؤلف! بينما يمكنك استخدامه مجانًا، تذكر أن إعادة نشر الكود يخضع لقواعد الموقع الخاصة بنا.
إخلاء المسؤولية
لا يُقصد بالمعلومات والمنشورات أن تكون، أو تشكل، أي نصيحة مالية أو استثمارية أو تجارية أو أنواع أخرى من النصائح أو التوصيات المقدمة أو المعتمدة من TradingView. اقرأ المزيد في شروط الاستخدام.