PROTECTED SOURCE SCRIPT
Session OHLC [neo.|]

OHLC/OLHC and Po3 (Power of Three by ICT) are both concepts describing a potential way to describe candle formations. While OHLC stands for Open High Low Close, what it usually refers to is the bearish scenario of how a candle first opens, manipulates until the high then creates the low before closing, and vice versa for OLHC. Po3 goes hand in hand with this concept as a way to sequentialize this candle formation into three separate cycles seen on a lower timeframe known as "Accumulation", "Manipulation", and "Distribution". Where the accumulation in the OHLC scenario would be the range created before the high, the manipulation being the high, and the distribution being the run downwards to the low.

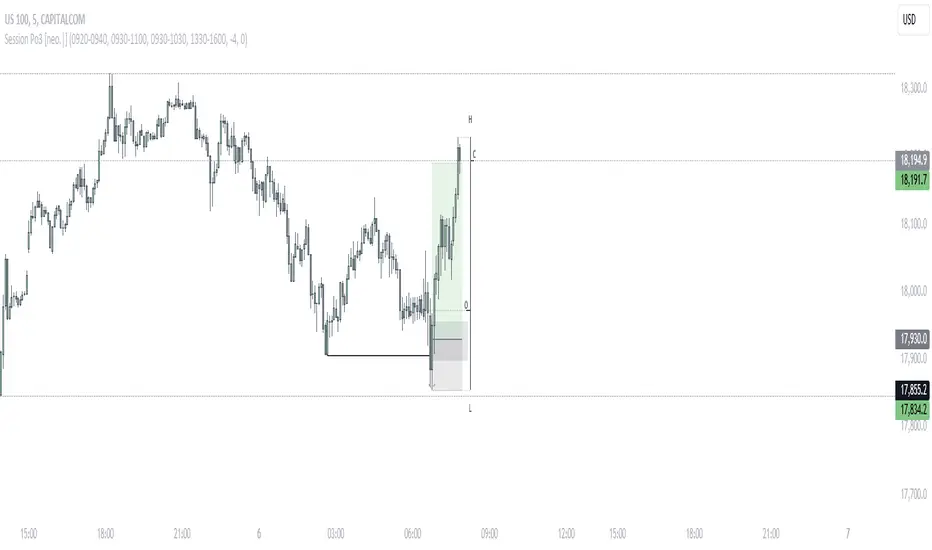
What Session OHLC allows you to do, is to view these Po3 scenarios not through a higher timeframe candle perspective, but instead through a fully customizable session perspective. For example, you might want to see a specific period of time as a candle to simplify the process of identifying an AMD cycle, and all you would need to do is to enter that period of time in the indicator settings, and when you are at that period of time, you will see it being represented as a bar candle, with the session open, high, low, and close being annotated as O, H, L, and C.
This is especially useful for when you want to track the manipulation before a session open, or track a specific time where there is more volume in the market, allowing you to enter trades prior to when a distribution phase will begin.

Currently, you are able to select up to 4 different sessions that will appear on your chart while the session is active, however it is a good idea for the session times you choose not to overlap as the drawings will overlap as well. If you would like to monitor two times that happen to overlap, it is a good idea to add another instance of the indicator to your chart, and adjust the bar offset on one of them in the settings.
What Session OHLC allows you to do, is to view these Po3 scenarios not through a higher timeframe candle perspective, but instead through a fully customizable session perspective. For example, you might want to see a specific period of time as a candle to simplify the process of identifying an AMD cycle, and all you would need to do is to enter that period of time in the indicator settings, and when you are at that period of time, you will see it being represented as a bar candle, with the session open, high, low, and close being annotated as O, H, L, and C.
This is especially useful for when you want to track the manipulation before a session open, or track a specific time where there is more volume in the market, allowing you to enter trades prior to when a distribution phase will begin.
Currently, you are able to select up to 4 different sessions that will appear on your chart while the session is active, however it is a good idea for the session times you choose not to overlap as the drawings will overlap as well. If you would like to monitor two times that happen to overlap, it is a good idea to add another instance of the indicator to your chart, and adjust the bar offset on one of them in the settings.
نص برمجي محمي
تم نشر هذا النص البرمجي كمصدر مغلق. ومع ذلك، يمكنك استخدامه بحرية ودون أي قيود - تعرف على المزيد هنا.
إخلاء المسؤولية
لا يُقصد بالمعلومات والمنشورات أن تكون، أو تشكل، أي نصيحة مالية أو استثمارية أو تجارية أو أنواع أخرى من النصائح أو التوصيات المقدمة أو المعتمدة من TradingView. اقرأ المزيد في شروط الاستخدام.