OPEN-SOURCE SCRIPT
تم تحديثه Dual timeframe calculated candles
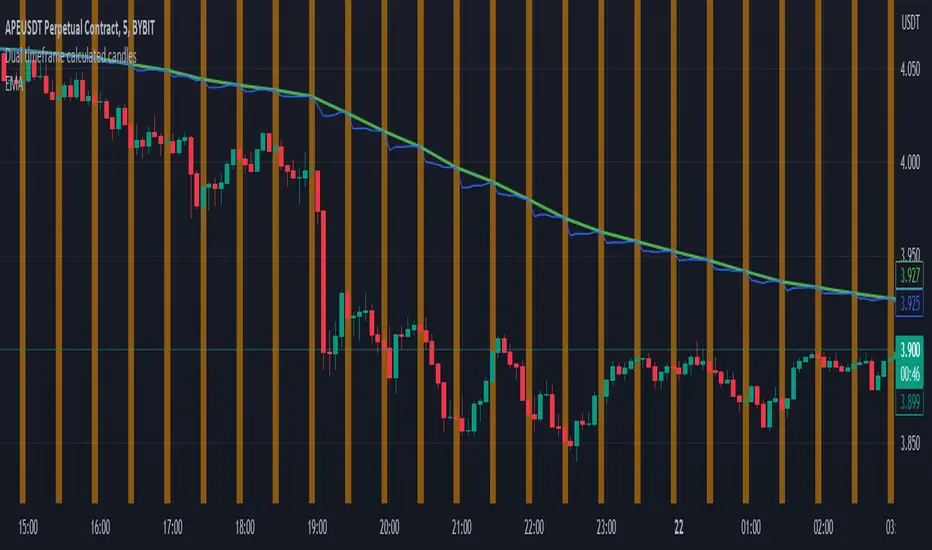
A script example to show how you can calculate the value of certain indicators from a higher timeframe at the moment that a bar closes on a shorter timeframe.
In this example the base chart is set to 5 mins and the multiplier is set to 6, so the HTF arrays hold data equivalent to that from the 30 minute chart which will hopefully appear below it on this display.
Each time a 5 minute bar completes, the arrays are updated by checking whether a new high or low has been set. The values for the HTF ATR and EMA are also updated by removing the most recent value from that array and replacing it with the value that would have been calculated based on the close at that time. As such for back testing purposes you'd know exactly what the 30 min chart would have been showing you at any one of the 5 minute intervals. Useful for backtesting strategies if you would rather act on the "up to the minute" HTF data, rather than the HTF data from the last HTF close, which could be significantly delayed if you're using a high enough multiplier.
ملاحظات الأخبار
Chart update for clarity. Green line is the EMA function applied to the chart with its timeframe set to 30 mins. As you'll see it coincides with the values the script calculates every 6 bars, but between those times the calculated EMA differs as the close from each 5 min candle would change the most up to date HTF line as well.ملاحظات الأخبار
Removed the option of setting how many HTF bars to keep. If this was set to a value less than the EMA length, then the HTF EMA never initialised properly.It's probably not needed to trim the arrays for memory purposes, but just in case the arrays are now trimmed to 110% of the emaLength (plus 2 more for good measure).
نص برمجي مفتوح المصدر
بروح TradingView الحقيقية، قام مبتكر هذا النص البرمجي بجعله مفتوح المصدر، بحيث يمكن للمتداولين مراجعة وظائفه والتحقق منها. شكرا للمؤلف! بينما يمكنك استخدامه مجانًا، تذكر أن إعادة نشر الكود يخضع لقواعد الموقع الخاصة بنا.
إخلاء المسؤولية
لا يُقصد بالمعلومات والمنشورات أن تكون، أو تشكل، أي نصيحة مالية أو استثمارية أو تجارية أو أنواع أخرى من النصائح أو التوصيات المقدمة أو المعتمدة من TradingView. اقرأ المزيد في شروط الاستخدام.