OPEN-SOURCE SCRIPT
تم تحديثه liquidity volume

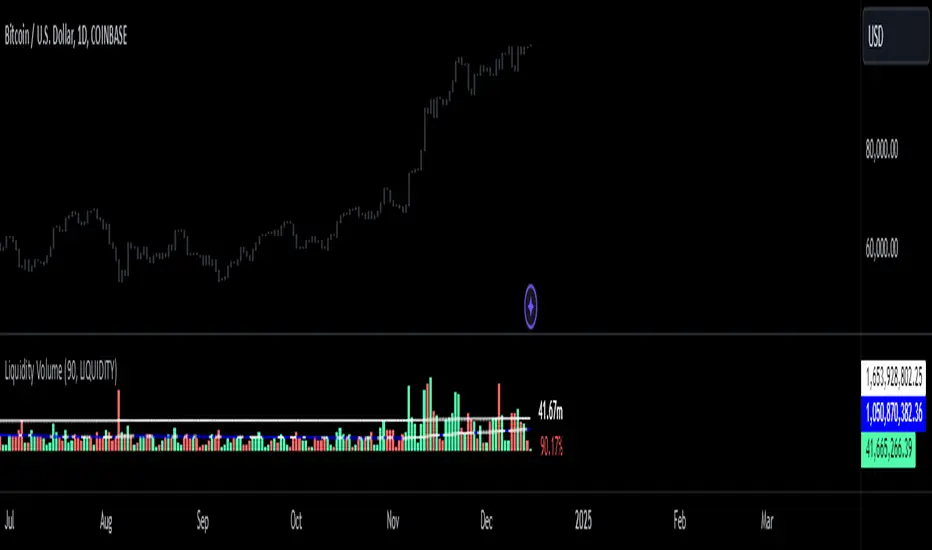
just like volume, this indicator shows how much in dollars were traded in millions.
ملاحظات الأخبار
made the volume bars represent colors based on bearish or bullish movementملاحظات الأخبار
added a mean (average) to the script. ملاحظات الأخبار
added a 3rd standard deviation to the indicator. a 3sd occurrence has a 0.2% chance of occurrence on a statistical standpoint. but when it comes to markets it happens more often. nonetheless, a 3sd alert can signify a major market movement due to increase of activity of dollars going in or out of that asset you are observing. P.S.A. go on settings, under style tab, change the "price line" to a histogram. ملاحظات الأخبار
changed the plotted liqudity to a column ملاحظات الأخبار
when the line is purple that means that liquidity is going down. when the line is white that means liquidity is going up ملاحظات الأخبار
ive made improvements on the script. easier to use and readملاحظات الأخبار
made a little bit more modificationملاحظات الأخبار
you can switch from representation of liquidity and equity. equity is just normal volumeملاحظات الأخبار
we have added a new stat. you can see how much volume has increased/decreased from the previous bar in percentageملاحظات الأخبار
modified the separation of labels so no overlapping occursملاحظات الأخبار
نص برمجي مفتوح المصدر
بروح TradingView الحقيقية، قام مبتكر هذا النص البرمجي بجعله مفتوح المصدر، بحيث يمكن للمتداولين مراجعة وظائفه والتحقق منها. شكرا للمؤلف! بينما يمكنك استخدامه مجانًا، تذكر أن إعادة نشر الكود يخضع لقواعد الموقع الخاصة بنا.
إخلاء المسؤولية
لا يُقصد بالمعلومات والمنشورات أن تكون، أو تشكل، أي نصيحة مالية أو استثمارية أو تجارية أو أنواع أخرى من النصائح أو التوصيات المقدمة أو المعتمدة من TradingView. اقرأ المزيد في شروط الاستخدام.