OPEN-SOURCE SCRIPT
Quasimodo Pattern

What is a Quasimodo Pattern?
A Quasimodo Pattern is a chart pattern traders look for to predict possible price reversals in the market:
- Bullish Quasimodo: Signals a possible price increase (buying opportunity).
- Bearish Quasimodo: Signals a potential price decrease (selling opportunity).
How the Script Works
1. Bullish Quasimodo:
- Checks if the price pattern shows signs of a potential upward movement:
- The current low price is higher than a previous price point (suggesting fair value gap).
- The previous candle closed higher than it opened (bullish candle).
- The candle before that closed lower than it opened (bearish candle).
2. Bearish Quasimodo:
- Looks for signs of a downward movement:
- The current high price is lower than a previous price point (suggesting fair value gap).
- The previous candle closed lower than it opened (bearish candle).
- The candle before that closed higher than it opened (bullish candle).
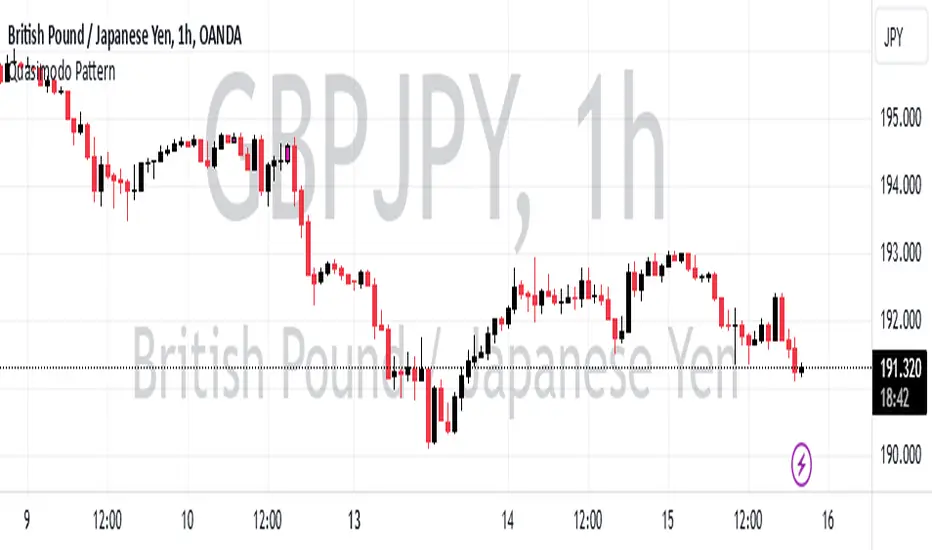
Visual Indicators
- Yellow Candles: Indicate a bullish Quasimodo pattern.
- Pink Candles: Indicate a bearish Quasimodo pattern.
Alerts
If a Quasimodo pattern is detected, the script sends an alert:
- The alert says: "A Quasimodo Pattern has appeared!"
Purpose
Traders can use this tool to quickly spot potential trend changes without manually analyzing every chart, saving time and improving decision-making for trades.
نص برمجي مفتوح المصدر
بروح TradingView الحقيقية، قام مبتكر هذا النص البرمجي بجعله مفتوح المصدر، بحيث يمكن للمتداولين مراجعة وظائفه والتحقق منها. شكرا للمؤلف! بينما يمكنك استخدامه مجانًا، تذكر أن إعادة نشر الكود يخضع لقواعد الموقع الخاصة بنا.
إخلاء المسؤولية
لا يُقصد بالمعلومات والمنشورات أن تكون، أو تشكل، أي نصيحة مالية أو استثمارية أو تجارية أو أنواع أخرى من النصائح أو التوصيات المقدمة أو المعتمدة من TradingView. اقرأ المزيد في شروط الاستخدام.