OPEN-SOURCE SCRIPT
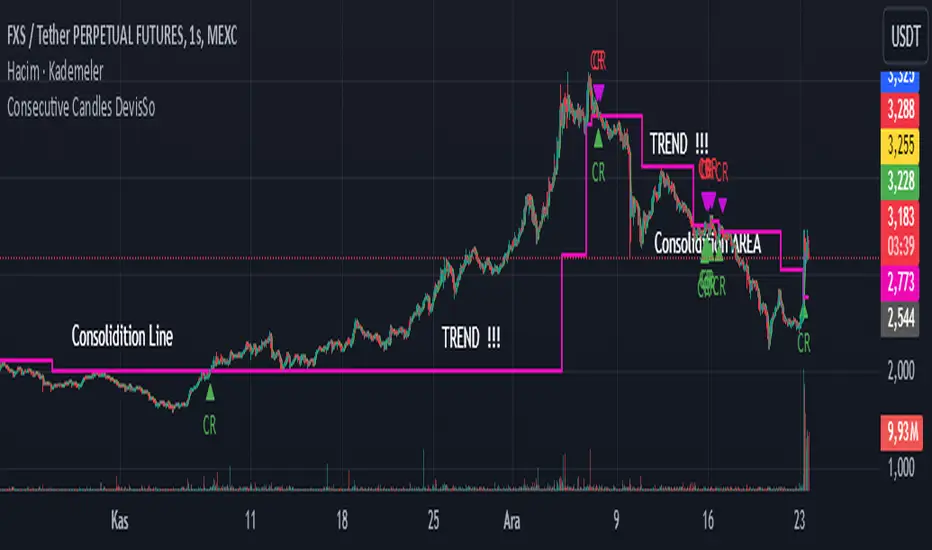
Consecutive Candles DevisSo

Hi Traders !!!
Level Calculation:
50% and 23.6% Fibonacci levels are calculated based on the open and close of the previous candles.
Consecutive Candle Check:
For an uptrend: Each candle's low must not touch the 50% levels of the previous candles.
For a downtrend: Each candle's high must not touch the 50% levels of the previous candles.
Pullback Level:
When a long signal is triggered, the current candle's low is recorded as a pullback level.
When a short signal is triggered, the current candle's high is recorded as a pullback level.
Breakout and Signal Generation:
If the price breaks above the calculated level, a long signal is generated; if it breaks below, a short signal is generated.
These signals are visualized on the chart.
Continuity:
The system checks the last signal to ensure the validity of new signals, maintaining the consistency of consecutive signals.
نص برمجي مفتوح المصدر
بروح TradingView الحقيقية، قام مبتكر هذا النص البرمجي بجعله مفتوح المصدر، بحيث يمكن للمتداولين مراجعة وظائفه والتحقق منها. شكرا للمؤلف! بينما يمكنك استخدامه مجانًا، تذكر أن إعادة نشر الكود يخضع لقواعد الموقع الخاصة بنا.
إخلاء المسؤولية
لا يُقصد بالمعلومات والمنشورات أن تكون، أو تشكل، أي نصيحة مالية أو استثمارية أو تجارية أو أنواع أخرى من النصائح أو التوصيات المقدمة أو المعتمدة من TradingView. اقرأ المزيد في شروط الاستخدام.