OPEN-SOURCE SCRIPT
تم تحديثه Average Range Targets
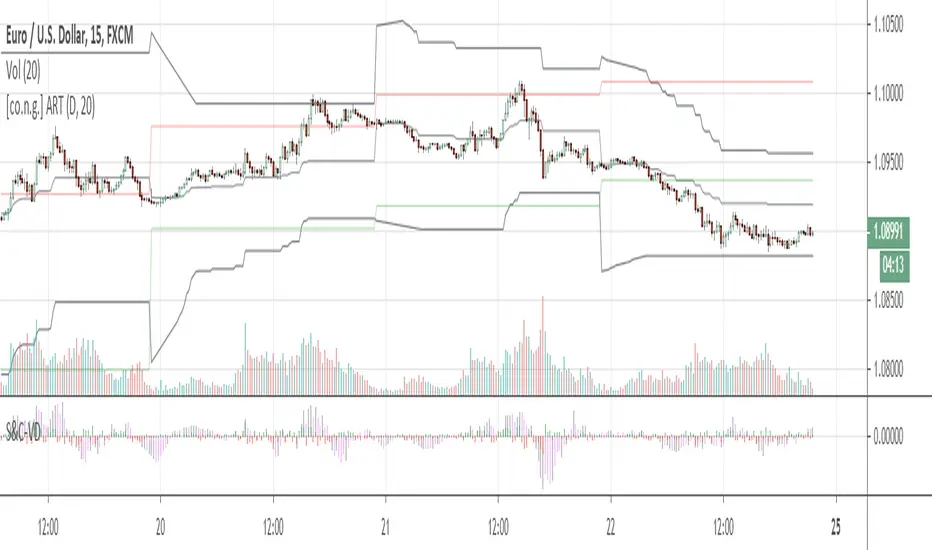
This super simple script helps spotting possible turnarounds and targets on intraday level.
The average daily range is calculated over a period of 20 days, which is approximately a trading month.
The black lines indicate the upper and lower range targets, moving closer with each new intrady high and low.
As you might recognize, in most cases the price is about to turn when one range target is hit.
The red and green lines are showing previous day's high and low as referneces.
Enjoy!
Warm regards,
Constantine Trading
ملاحظات الأخبار
Slimmed the script and sped up calculations, fixed plotting errors.1st:
I've added a midrange level. Usually, if price is below midrange, action is suppoes to be short;
if price is above otherwise.
2nd:
Most of the time price bounces once from range target level. If it reaches a second time, chances of breaking through are high.
HINT!
Don't rely solely on this script always watch out for a proper price action setup! Consider trend direction!
نص برمجي مفتوح المصدر
بروح TradingView الحقيقية، قام مبتكر هذا النص البرمجي بجعله مفتوح المصدر، بحيث يمكن للمتداولين مراجعة وظائفه والتحقق منها. شكرا للمؤلف! بينما يمكنك استخدامه مجانًا، تذكر أن إعادة نشر الكود يخضع لقواعد الموقع الخاصة بنا.
إخلاء المسؤولية
لا يُقصد بالمعلومات والمنشورات أن تكون، أو تشكل، أي نصيحة مالية أو استثمارية أو تجارية أو أنواع أخرى من النصائح أو التوصيات المقدمة أو المعتمدة من TradingView. اقرأ المزيد في شروط الاستخدام.