PROTECTED SOURCE SCRIPT
Variance Percentile
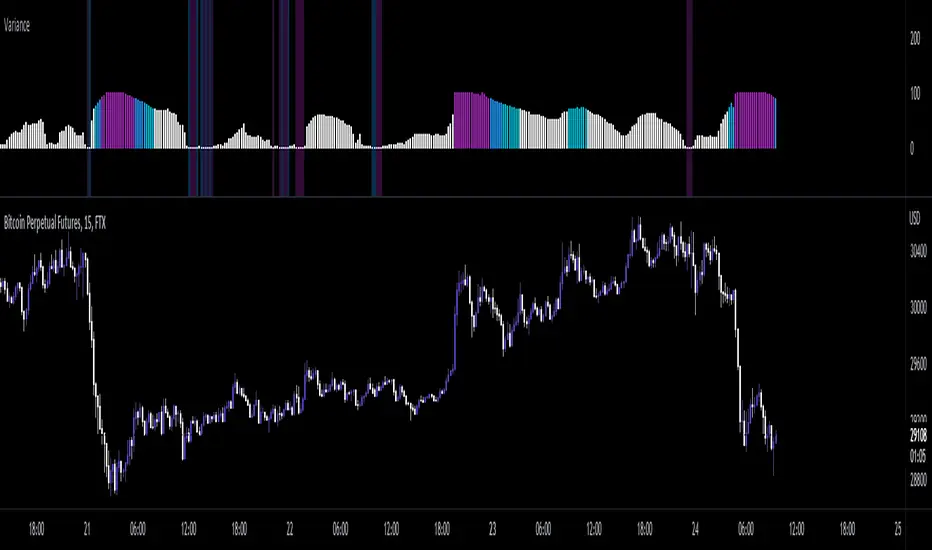
As repeated from my Variance Z-Score Script:
"Variance is a measure of dispersion, simply put, it is measuring how distant data is from it's mean(average). This indicator allows you to see when variance is increasing or decreasing, as well as when it is at an extreme value. Thru this, you can get a more accurate description of risk. When variance is increasing/high, you know to expect larger moves, as data(price) is far and getting farther from the mean. and when it is low/decreasing, you know that price movement is more likely to be less volatile due to data clustering closer to the mean, ie ; smaller values."
With Variance Percentile, we apply a percent rank function to get some statistical context from raw variance data. Used the same as my pervious Historical volatility indicator, it shows what % of historical data was less than or equal to the current value, allowing us to find point where variance is statistically likely to increase, as well as when it is at an extreme.
Recommended to paired with Historical volatility or Volatility Z-score to assist in establishing a more accurate estimation of market volatility
نص برمجي محمي
تم نشر هذا النص البرمجي كمصدر مغلق. ومع ذلك، يمكنك استخدامه بحرية ودون أي قيود - تعرف على المزيد هنا.
إخلاء المسؤولية
لا يُقصد بالمعلومات والمنشورات أن تكون، أو تشكل، أي نصيحة مالية أو استثمارية أو تجارية أو أنواع أخرى من النصائح أو التوصيات المقدمة أو المعتمدة من TradingView. اقرأ المزيد في شروط الاستخدام.